Dashboard

October 01, 2024
Your Admin Dashboard is your hub for keeping your finger on the pulse of your business. Take a look at how it breaks out sales and inventory data for you.
Whenever you log into your Admin, your Dashboard page will load for you so you can see what's going on at a glance with your store. From anywhere in the Admin you can get back to your Dashboard with the link in the upper left.
Using Your Admin Dashboard
Your Dashboard offers a wealth of instant information in an attractively laid-out page. Here is what each area has to offer:
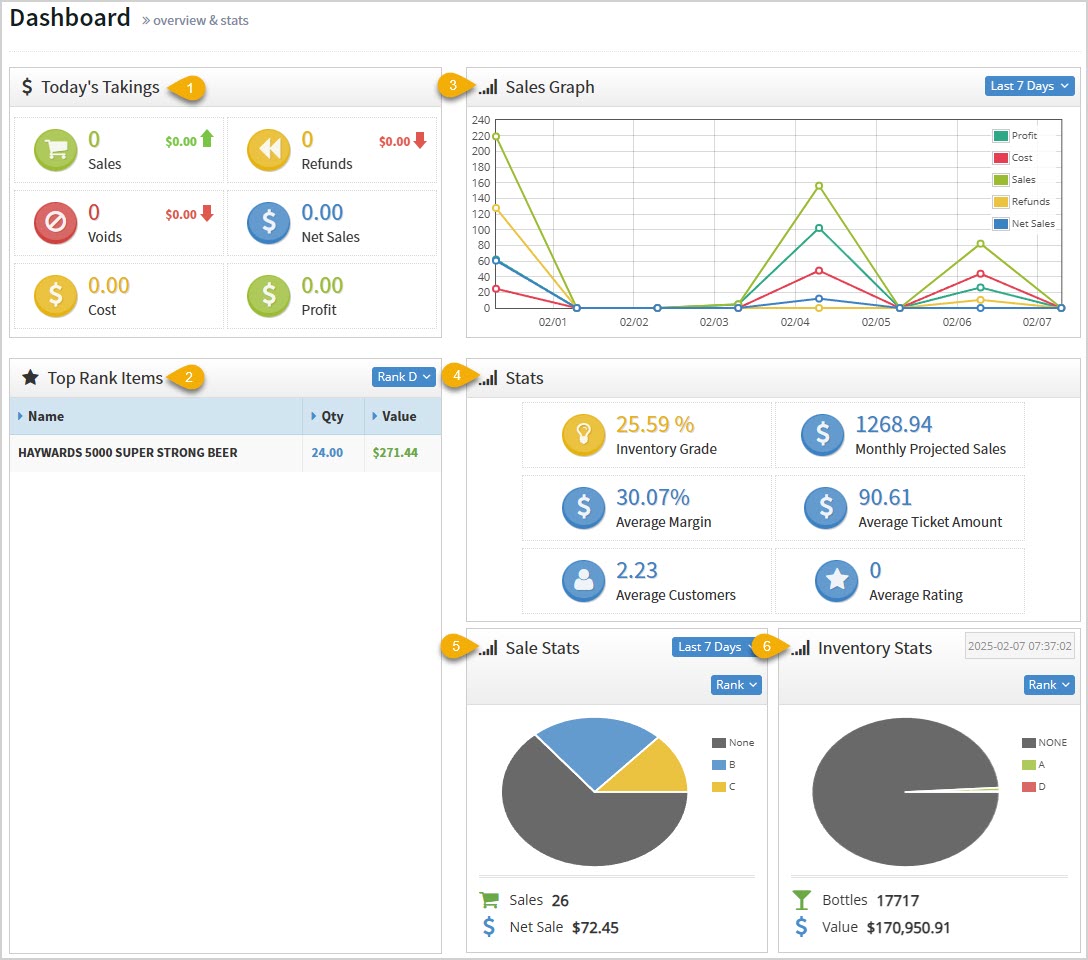
- Today's Takings – This area displays the following data across all of your stores for you:
- The total number of Sales. It also shows the total dollar amount of your sales.
- The total number of Refunds. It also shows you the total dollar amount of your refunds.
- The total number of Voids. It also shows you the total dollar amount of your voided transactions.
- The total dollar amount of Net Sales. These are your sales totals after Refunds and Voids have been removed.
- The total Cost you paid for sold items.
- The total dollar amount of your Profits.
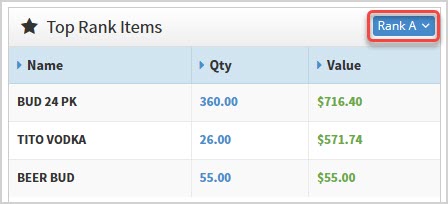
- Top Rank Items – This area allows you to filter by the four different Ranks (A, B, C, and D) using the drop-list in the upper right and see which items in each Rank are your top sellers. In the example above, we see Rank D items, and we're early in the day so there's only one. Below we see Rank A items. Rank A is the top 20% of your sales, Rank B is the middle 60% of your sales, Rank C inventory falls into the bottom 20% of your sales, and Rank D inventory has no sales history. The table shows you the item Name, the Quantity sold, and the total dollar Value of the sold items.
- Sales Graph – By default you'll see a line graph of the Last 7 Days of your sales, and you can change the time range with the drop-list in the upper right. The Sales Graph shows the total dollar value of your Sales transactions, your Net Sales, the Cost of all your items, the dollar amount of your Refunds, and your Profit.
- Stats – The Bottle POS keeps constant track of your inventory and sales performance, and the Stats area offers you the following key data points:
- Inventory Grade – This is calculated based on the spread of Ranked items across your inventory. If you have a higher balance of the higher ranks, your inventory will be graded higher. The higher your percentage score in this area, the better your inventory is performing.
- Monthly Projected Sales – Based on your sales history, this is the system's prediction on total sales for the month.
- Average Margin – This is the average profit margin on items you have sold.
- Average Ticket Amount – This is the average individual transaction Total across all of your sales transactions for the period.
- Average Customers – This is the average of the number of daily customers per store.
- Average Rating – This is the average number of stars given to your store from the customer-facing display, if you have that setting active.
- Sale Stats – This pie chart breaks down your Total Sales across all item Ranks in the default view for your inventory, and also shows any unranked inventory. By default we see the Last 7 Days, but you can use the drop-list in the upper right to adjust the date range. With all charts in this area you can hover over a section or click on it to see details. You can also adjust the Mode of the chart to any of the following:
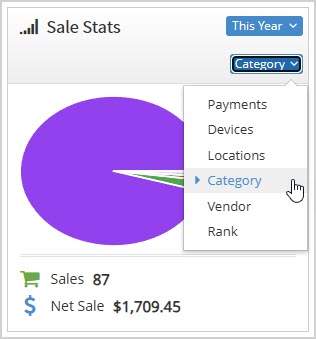
- Payments – This will break down sales dollars for the period by Tender type.
- Devices – This will show each Device / Register that had sales during the period and how much for each.
- Locations – For the current store, this will show sales by Locations within the store.
- Category – This will break out dollar totals by the Categories you've created.
- Vendor – You will see sales totals for each of your Suppliers (vendors) for the period.
- Rank – This chart will show you sales by item Rank, including any items you haven't ranked yet. Again, Rank A is the top 20% of your sales, Rank B is the middle 60% of your sales, Rank C inventory falls into the bottom 20% of your sales, and Rank D inventory has no sales history.
- Inventory Stats – As with the Sale Stats and the Sales Graph, with all charts in this area you can hover over a section or click on it to see details. This chart starts with the inventory status at the current time, but you can click the Date area to see historical inventory quantities and values for previous dates. This area shows you your total number of items (Bottles), their total dollar Value, and breaks down your inventory in the following ways:
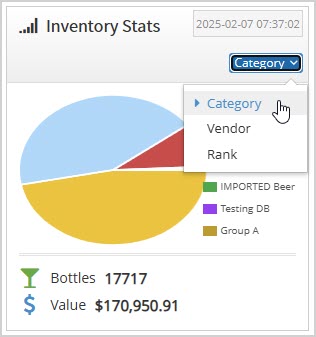
- Category – See your inventory quantities for your Categories.
- Vendor – See the quantities and value of your inventory broken down by Suppliers.
- Rank – See how many unranked items you have and the quantities for the four Ranks for your inventory.
Related Topics
Guide to the Admin Reports
Realtime
Frequently Asked Questions
Q: Can I print or export Dashboard data?
A: From the Dashboard, you cannot print or export, but the Admin Reports have that ability and go into more detail than the Dashboard.
Q: I have a question, but I can't find my answer here, how do I get more assistance?
A: You can ask any question at the number below. Contact our 24/7 support team at: (877) 381-4087
It's common for employees to forget to clock in or out and when that happens you need an easy option
Your Admin Realtime page gives you a live view of your sales as they come in and has some useful uti
The Reports in the Bottle POS Admin can show you details about all of your data, however you need to
Is this page helpful?
×Help us improve our articles