The Reports in the Bottle POS Admin can show you details about all of your data, however you need to see it. They are super easy to use and highly informative, take a look!
To get to this part of the system, sign in to your Admin. Click Reports in the upper left to view the reports detailed below.
The Admin Reports
The Admin Reports section offers a wide variety of reports to give you data on all aspects of your store. This article will give you an overview of the reports and links to more detailed articles for each one. They all follow the same easy-to-use format:
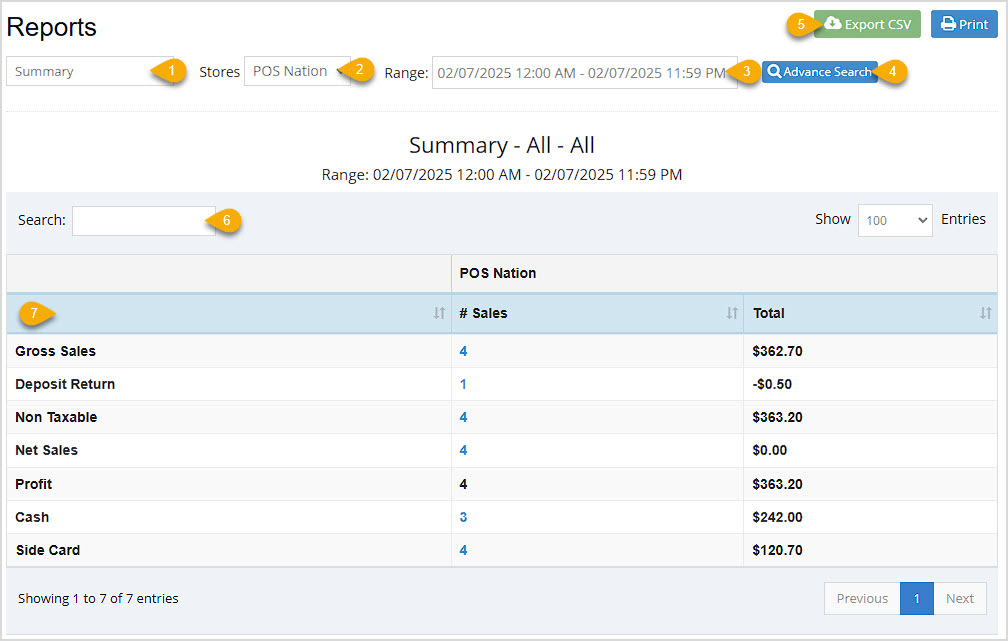
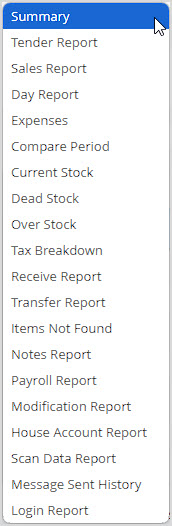
- Report Picker – Your master list of Admin Reports, click to open the list and select the one you want.
- Store Filter – If you have multiple stores, in some reports you'll be able to see results for individual stores with this filter.
- Date Range – Most reports allow you to filter for the date range you want. The Compare Periods report will let you look at two periods you define to compare data.
- Advance Search – This area allows for customized filtering based on the data for the report. This functionality is not on all reports.
- Export & Print – Export all of a report's data to a CSV spreadsheet file, or Print the current page of the report.
- Search – You can search by keyword or numeric value for any data in the report.
- Data Table – The data in each report is unique, so the columns you'll see will all offer data specific to the report. You can click the column headers to sort / reverse sort, and sometimes the data is linked to more detailed views such as a Transaction Details window or something similar.
Reports Overview
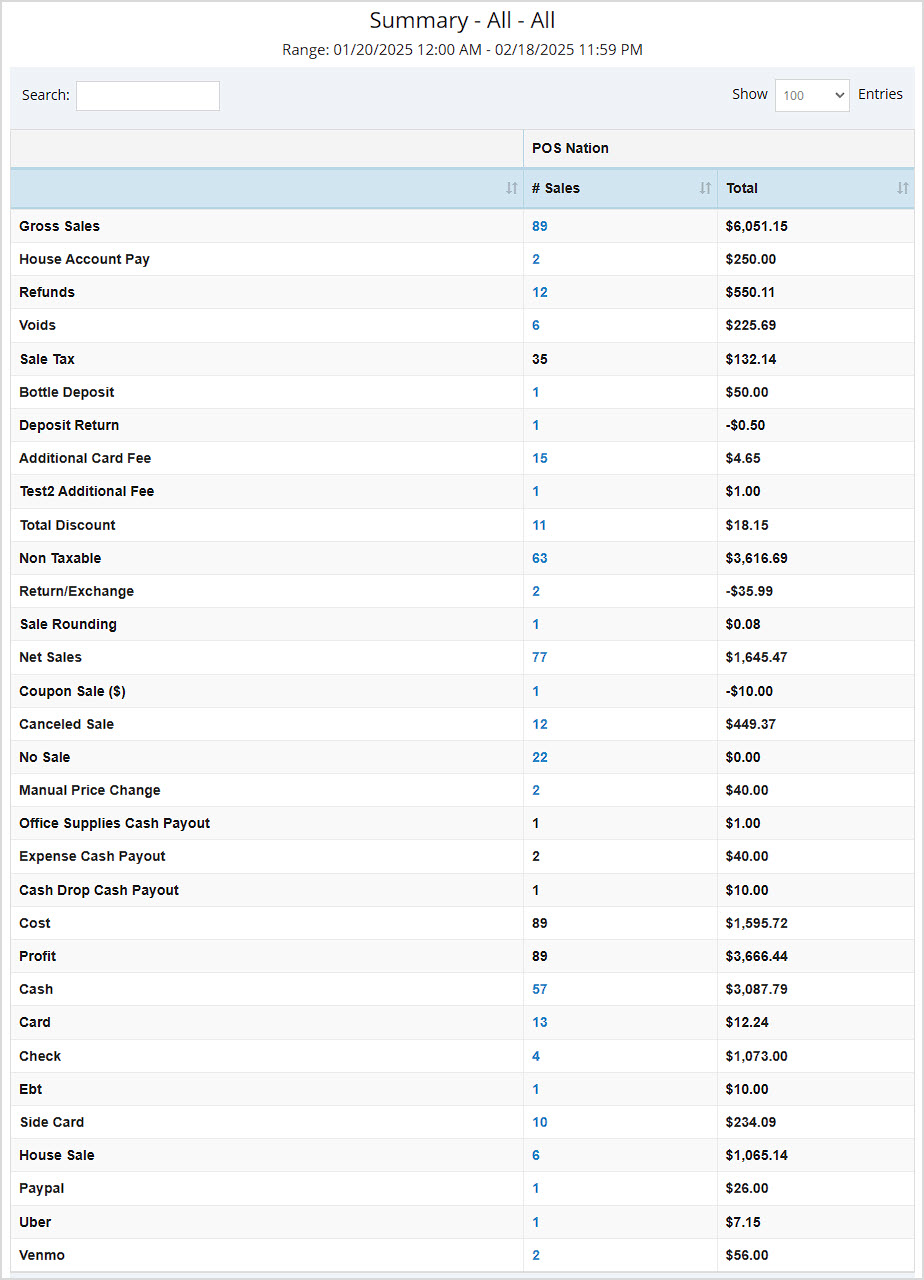
Summary Report
A summary of your sales displaying data for the current day, by default.
- This report can be filtered by your different Stores. When viewing a Date Range with more than one Shift, the report can be filtered by Shift.
- Advance Search allows you to filter by User, Device, and Item Type.
- The Data Table displays Net Sales, Gross Sales, Non-Taxable sales, Profit, Deposit Return, and sales by Tender type.
- For more details, click here: Summary Report
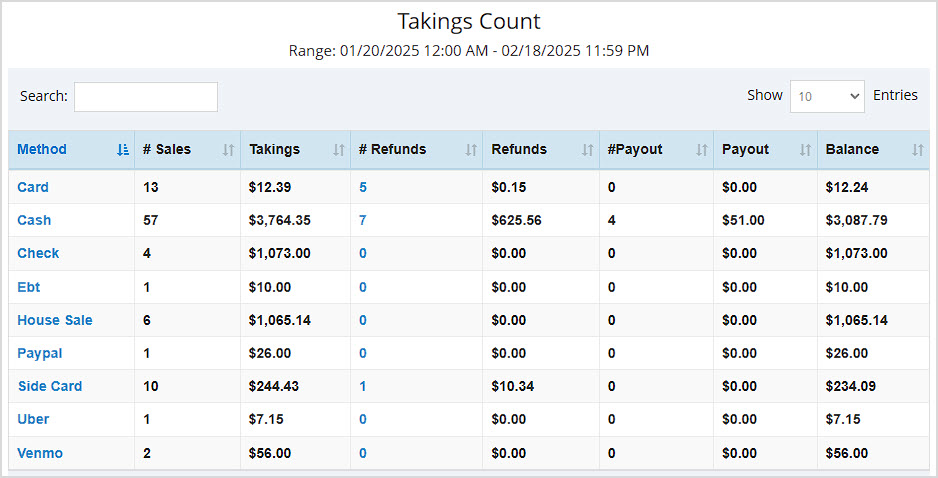
Tender Report
A breakdown of your sales by Tender type. Defaults to the current day's data.
- This report can be filtered by your different Takings Count (shown below), Location Takings, Device Takings, and User Takings.
- The Data Table displays (for most filters) Number of Sales, Takings dollar amount, Number of Refunds, Refunds dollar amount, Number of Payouts, Payouts dollar amount, and the adjusted Balance (total) for each line item.
- For more details, click here: Tender Report
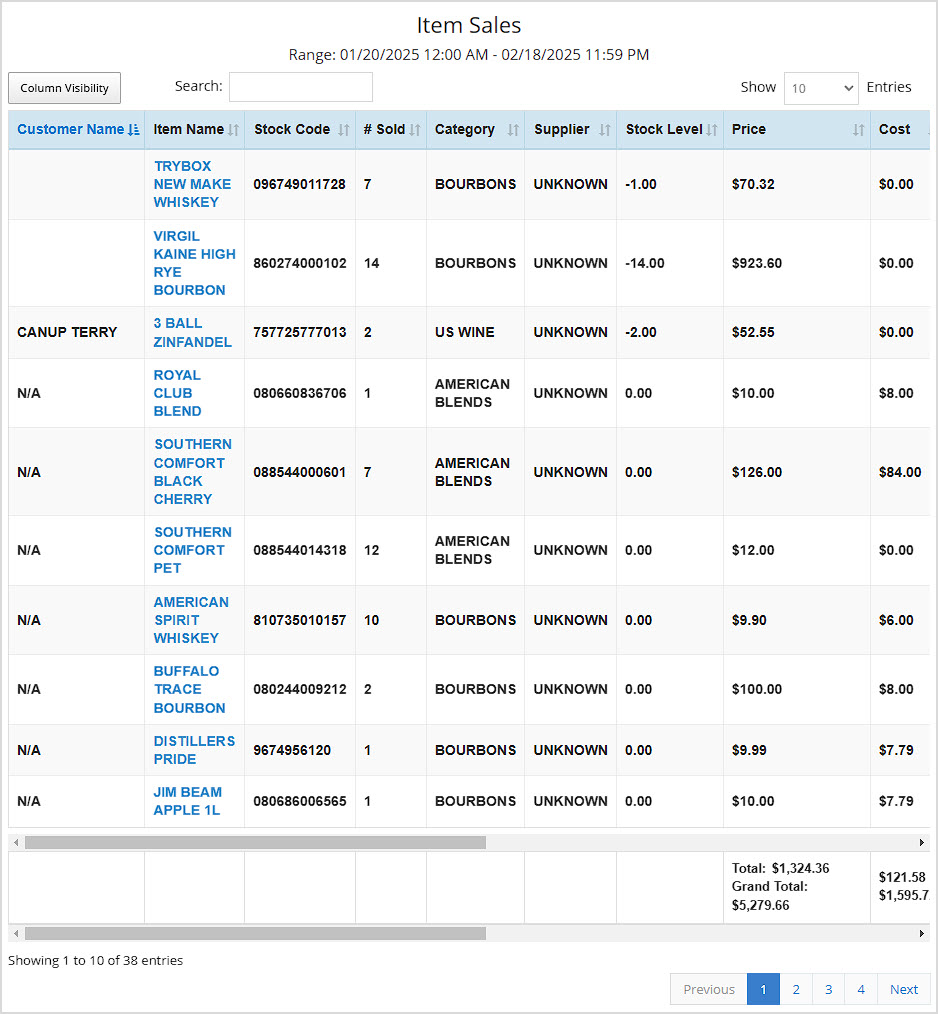
Sales Report
A summary of your Sales displaying data for the current day, by default.
- This report can be filtered by your different Item Sales (Shown below: offers a unique data table showing Customer Name, Item Name, Stock Code, Number Sold, Category, Supplier, Stock Level, Price, Cost, and Profit, other filters show identical table data described below), Supplier Sales, Category Sales, Rank Sales, Category Group Sales, and Item Sizes.
- Advance Search is available only in the Item Sales view and allows you to filter by Customer, Supplier, Category, User, Device, and Item Type.
- The Data Table for all views except Item Sales (detailed above) displays Name, Number Sold, Price, Cost, Profit, Margin %, Markup, Discounts, Total, Number Refunded, Total, and Balance.
- For more details, click here: Sales Report
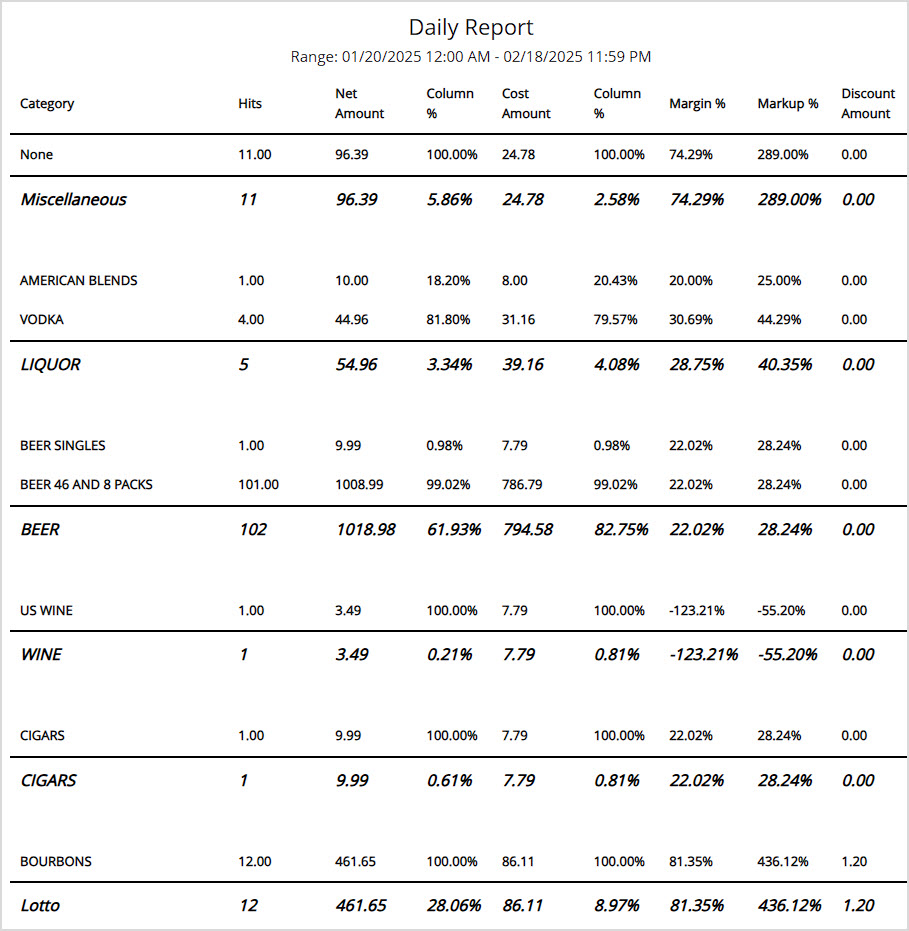
Day Report
A unique report that generates for the current day when selected.
- This report has no filters.
- The report shows tables for Taxable / Nontaxable, Discounts, Return, & Voids, Item Type Sales, Sales by Tender, Sales by Device, Sales Tax, and Ranked Sales.
- The data table offers details on Cash Payout, Customer Count, and Hourly Sales.
- For more details, click here: Day Report
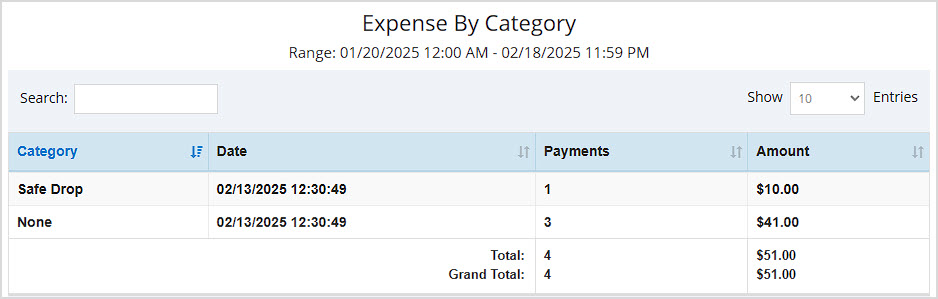
Expenses Report
A summary of your expenses displaying data for the current day, by default.
- The report can be filtered by Category (shown below), Vendor, Device, or All.
- The Data Table displays Category / Vendor / Device (or all three in the All view), Date, number of Payments, and the total dollar Amount.
- For more details, click here: Expenses Report
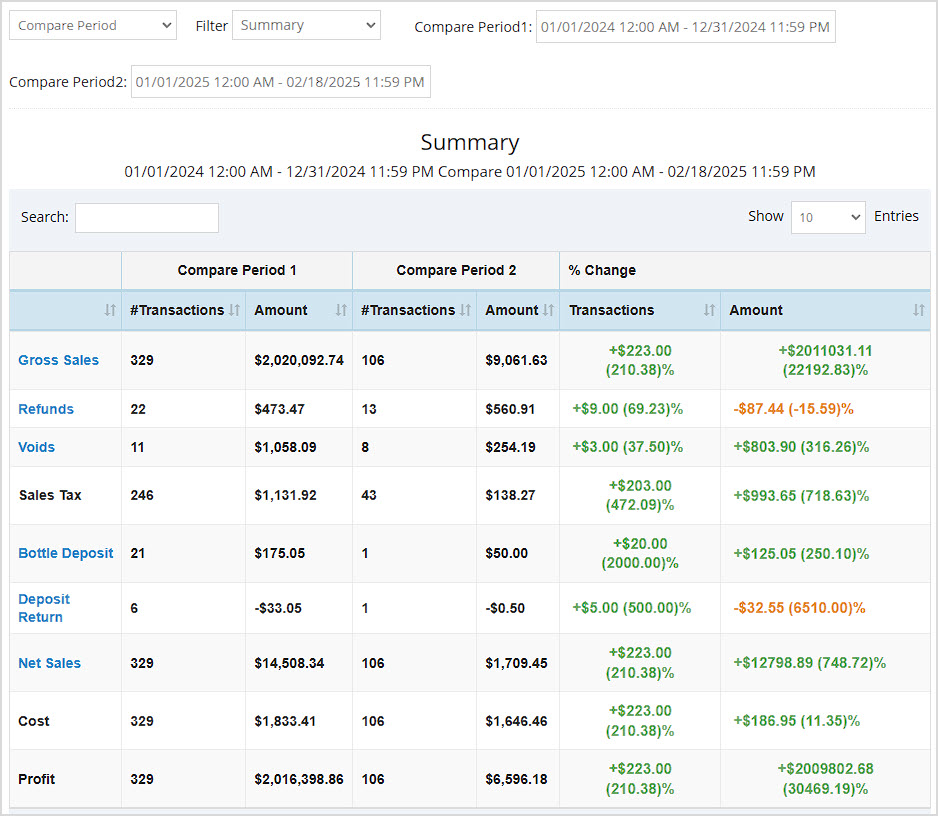
Compare Period Report
This allows you to see the number of sales and dollar amount for different sales data points compared between two different time periods you can define.
- It can be filtered by Summary (pictured below, showing Gross Sales, Refunds, Voids, Sales Tax, Bottle Deposit, Deposit Return, Net Sales, Cost, and Profit), Item Sales, Supplier Sales, Category Sales, Supplier Sales, Expense Categories, and Expense Vendor.
- The Data Table displays the filter item type name and the Number of Transactions / Dollar Amount for each of the two periods you define, then shows the Percentage change for the Number of Transactions / Dollar Amount.
- For more details, click here: Compare Period Report
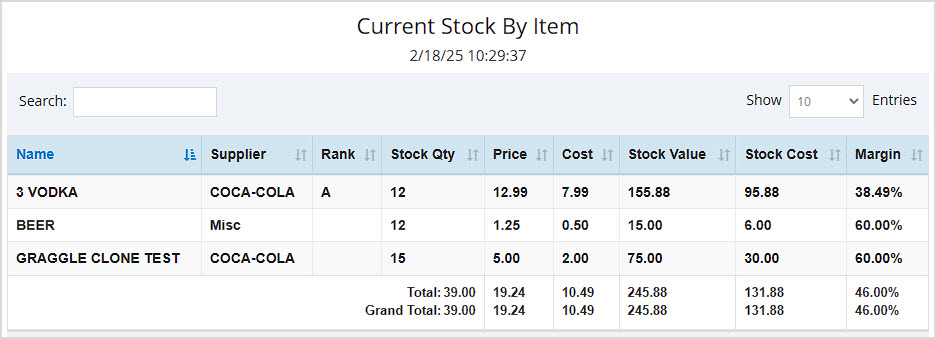
Current Stock Report
A summary of your inventory quantities and values as of the present time for the store you're currently logged into.
- This report can be filtered by Item (shown below), Category, Category Group, Supplier, and Rank.
- The Data Table displays Name, Supplier (Item View), Rank (Item View), Stock Quantity, Price, Cost, Stock Value, Stock Cost, and Margin.
- For more details, click here: Summary Report
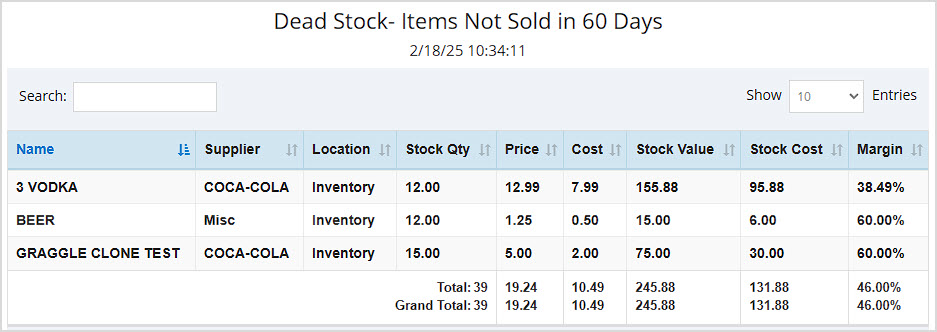
Dead Stock Report
This report shows Items Not Sold over different time frames.
- This report can be filtered by preset numbers of days (30, 60 (shown below), 90, etc.)
- The Data Table displays the item Name, Supplier, Location, Stock Quantity, Price, Cost, Stock Value, Stock Cost, and Margin.
- For more details, click here: Dead Stock Report
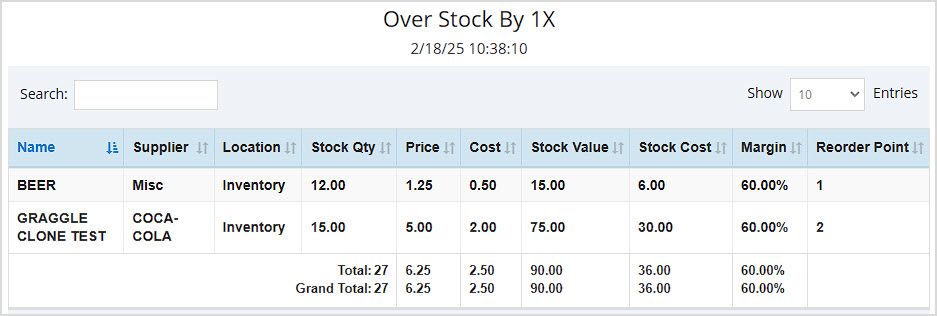
Over Stock Report
This report lets you see to what degree your inventory is overstocked and which items are overstocked.
- The results can be filtered by how many multiples the stock is over, e.g. 1x (shown below), 2x, and ranging up to 5x.
- The Data Table displays item Name, Supplier, Location, Stock Quantity, Price, Cost, Stock Value, Stock Cost, Margin, and Reorder Point.
- For more details, click here: Over Stock Report
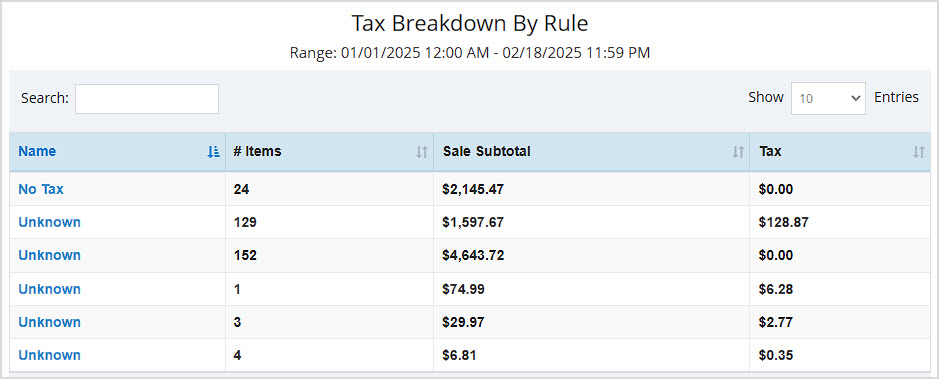
Tax Breakdown Report
This report summarizes your taxes by Tax Rule for the period you're viewing.
- This report can be filtered by your different Tax Rules (shown below) or your Tax Names.
- The Data Table displays Name, Number of Items, the Sale Subtotal, and Tax amount.
- For more details, click here: Tax Breakdown Report
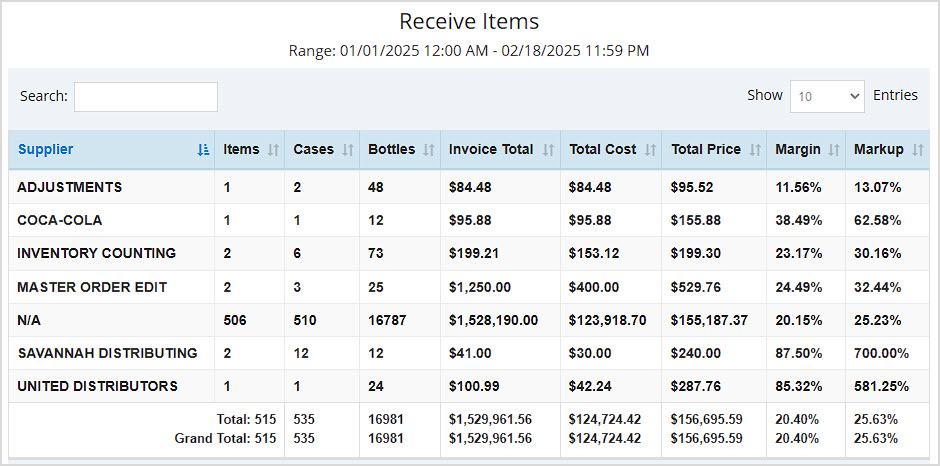
Receive Report
This report breaks down important data about inventory you have received in whatever date range you choose.
- This report can be filtered by Supplier (shown below), Items, and Category.
- The Data Table for the Supplier and Category views display Supplier, Items, Cases, Bottles, Invoice Total, Total Cost, Total Price, Margin, and Markup, with Totals for all columns.
- The Data Table for the Items view shows item Name, Supplier, Invoice Total, Invoice Number, and item Quantity.
- For more details, click here: Receive Report
Transfer Report
This report gives key information about all inventory Transfers you have done between your stores. If you don't have multiple stores in the Bottle POS you won't need this report.
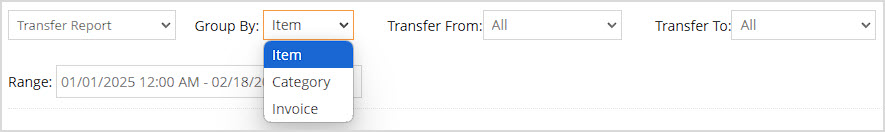
- You can filter by Item (shown below), Category, or Invoice. You can also filter by From and To stores where you did the Transfers.
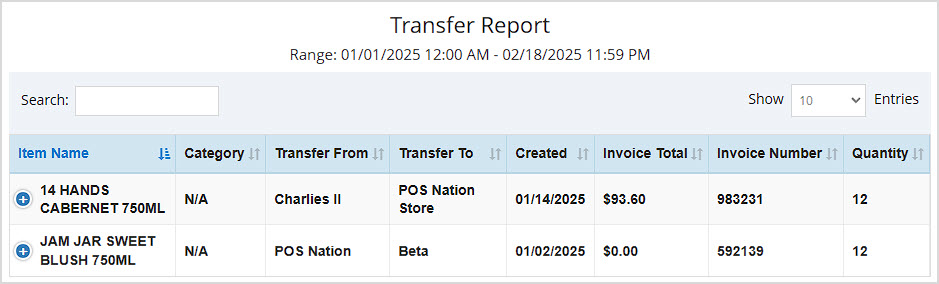
- The Data Table for the Item view displays Item Name, Category, Transfer From, Transfer To, date Created, Invoice Total, Invoice Number, and Quantity transferred.
- The Data Table for the Category view displays Item Category, Transfer From, Transfer To, Invoice Total, Quantity transferred, and the Total Cost.
- The Data Table for the Invoice view displays date Created, Transfer From, Transfer To, Items, Cases, Bottles, Invoice Total, Invoice Number, and Total Price. It also shows totals for Paid Receive, Unpaid Receive, Total Receive, Paid Transfer, Unpaid Transfer, and Total Transfer dollar values.
- For more details, click here: Transfer Report
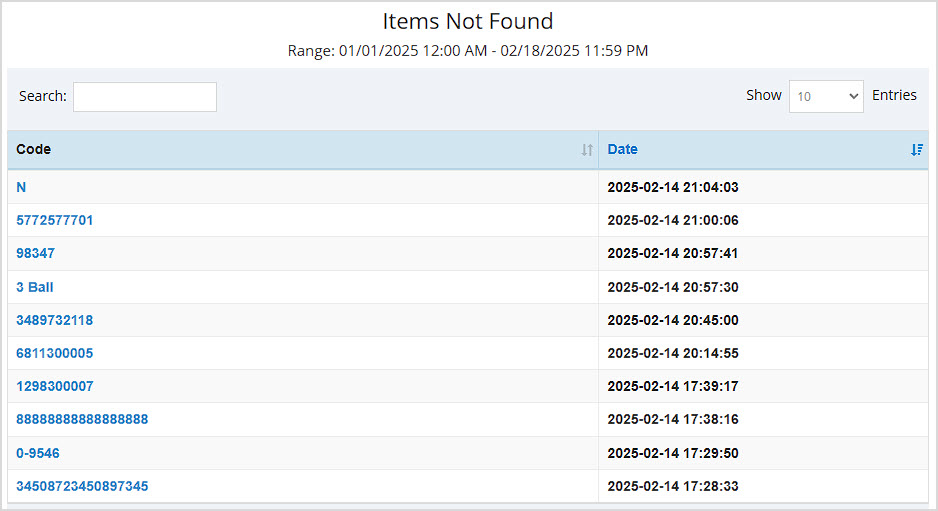
Items Not Found Report
What are your sales clerks searching for but not finding? This report helps you find items that might not have been entered into inventory yet.
- The Data Table displays the Code that was not found and the Date it happened.
- For more details, click here: Items Not Found Report
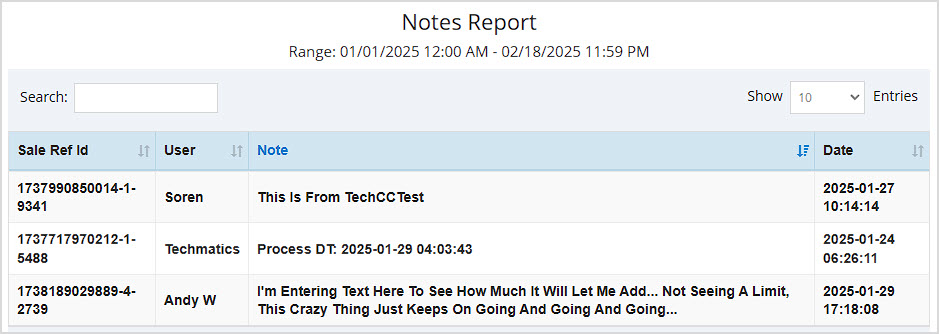
Notes Report
This report offers a compilation of all Notes saved on transactions done through the POS Register for whatever date range you choose.
- The Data Table displays the Sales Ref ID of the transaction, User, Note text, and the Date it was saved.
- For more details, click here: Notes Report
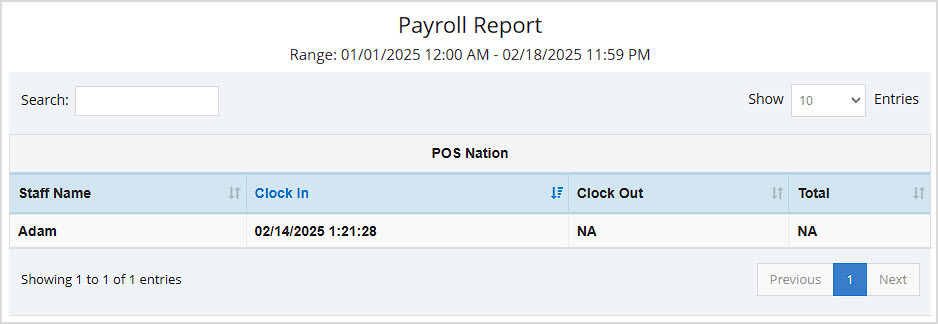
Payroll Report
This report allows you to see total clocked-in time for your staff for whatever date range you have selected.
- This report can be unfiltered using the None option (shown below) or can be filtered by members of your Staff. There are additional filters to view data by an individual Staff member, and by Store.
- The Data Table for the unfiltered (None) view displays Staff Name, Clock In date and time, Clock Out, and Total time accrued.
- The Data Table for the By Staff view shows Staff Name, Mobile number, Store Total time accrued, and Grand Total time accrued if they worked in multiple stores.
- For more details, click here: Payroll Report
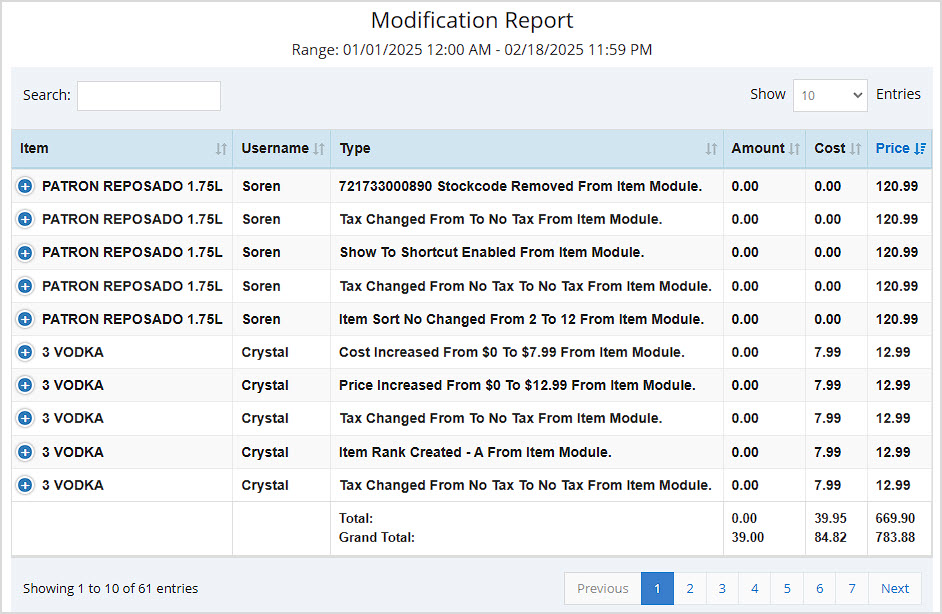
Modification Report
This report compiles events where any data changes were made to your inventory.
- This report can be filtered by Item (shown below), Category, Supplier, and Task List.
- The Data Table for the Item view displays the Item name, Username of who made the modification, Type of modification, Amount, Cost, and Price.
- The Data Table for the Category view displays the Category Name, Message, Action, Action By, and Date & Time of the event.
- The Data Table for the Supplier view displays the Supplier Name, Message, Action, Action By, and Date & Time of the event.
- The Data Table for the Tasklist view displays the Tasklist Name, Message, Action, Action By, and Date & Time of the event.
- For more details, click here: Modification Report
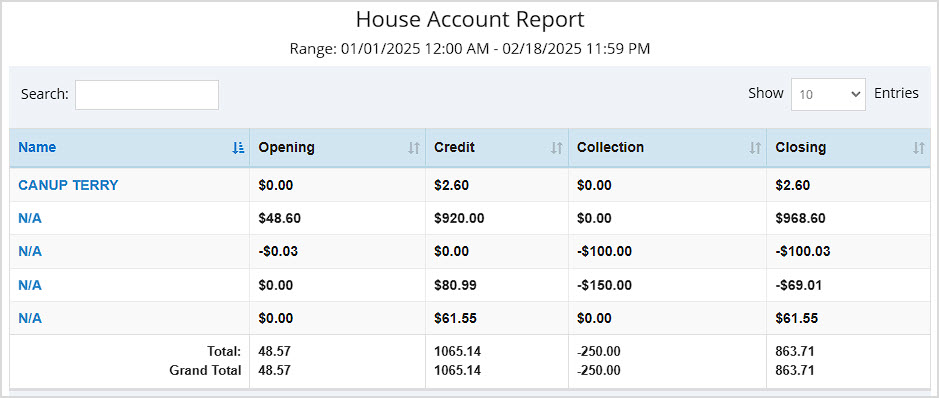
House Account Report
This report shows important amounts for your House Accounts for the date range you choose.
- The Data Table displays the house account Name, Opening balance, Credit amount, Collection amount, and Closing amount. It also provides Totals for all numeric columns.
- For more details, click here: House Account Report
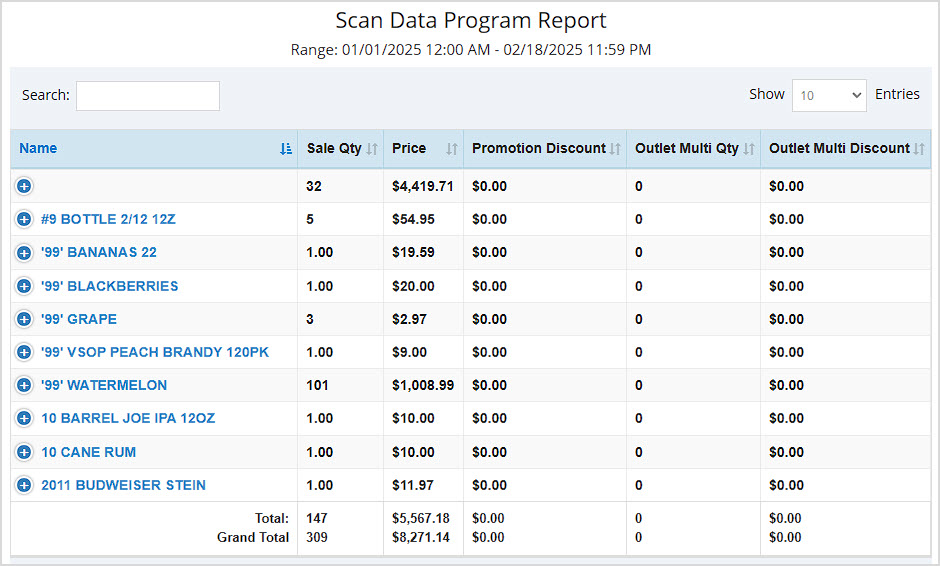
Scan Data Report
In this report you can find a comprehensive list of all items scanned into your POS Register for the date range you have chosen.
- The Data Table displays the item Name, Sale Quantity, Promotion Discount, Outlet Multi Quantity, and Outlet Multi Discount. It also shows Totals and Grand Totals (across all pages of data) for all numeric columns.
- For more details, click here: Scan Data Report
Message Sent History Report
For SMS messages you send to customers, this report gives important send and receive information for whatever date range you select.
- The Data Table displays the Message text, the Total Send To Number of customers, the Failed To Number, and the Sent On date and time.
- For more details, click here: Message Sent History Report

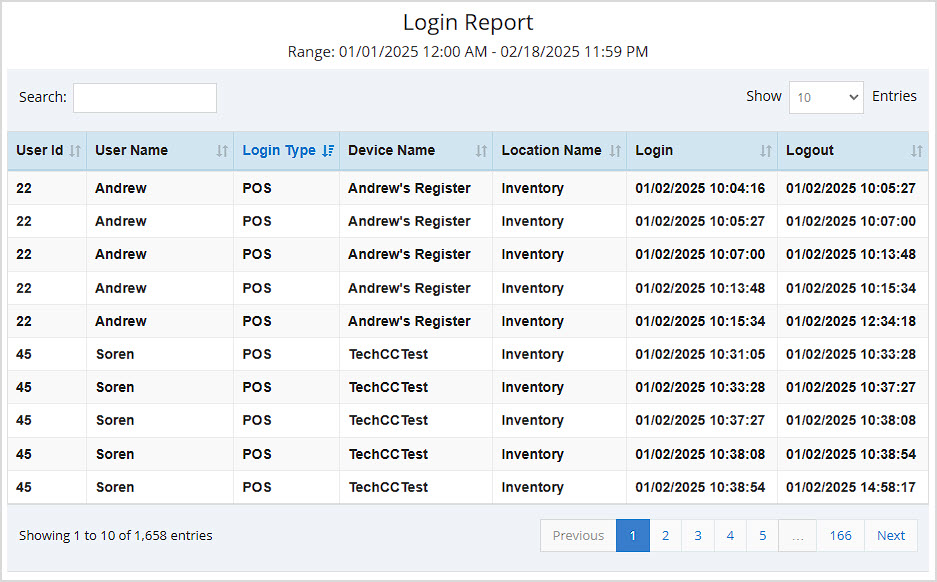
Login Report
See all system logins and logouts for all staff members in this useful report.
- The Data Table displays the staff member's User ID, User Name, Login Type, Device Name, Location Name, Login date and time, and Logout date and time.
- For more details, click here: Login Report
Related Topics
Guide to the POS Reports
Frequently Asked Questions
Q: Can I print my reports from the Admin?
A: Yes. If you have a printer connected to your device, you can click the Print button in the upper right to print the current page of the report you are viewing.
Q: I don't see a way to switch stores in the Sales Report, how do I see data for my other stores?
A: While some of the reports have a filter for Store, most will show you data for the store your User account is currently logged into. You can click the Logout button in the upper right and then log in again to choose a different store.
Q: I have a question, but I can't find my answer here, how do I get more assistance?
A: You can ask any question at the number below. Contact our 24/7 support team at: (877) 381-4087
 October 01, 2024
Is this page helpful?
×Help us improve our articles