Day Report (Admin)

October 01, 2024
The Bottle POS Admin app's Day Report gives you a wealth of information about what happened in your store during whatever date range you prefer. Take a look at what it has for you!

How to Work with the Day Report
To get to this report, log in to your Admin app and go to Reports. Select Day Report in the report selection drop-list.
Day Report Details
This report is an in-depth analysis of your sales and profits across a specified date range and includes details not shown in any other report. You can use this report to make sure your drawers are balanced at the end of each shift. The Day Report shows data for the Register you are currently logged into.
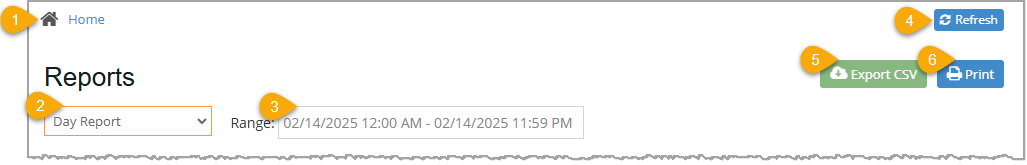
- Home – Click to navigate away from Reports back to your Dashboard.
- Report Drop-List – Click the Day Report to view an analysis of your sales and profits across a specified range of dates.
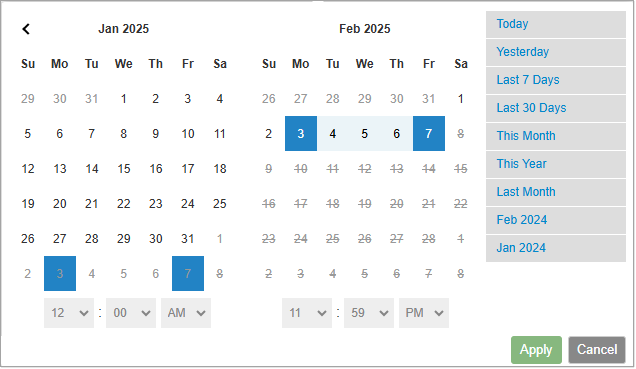
- Range – This is the Date Range used in the report calculations in the table below. Click in this box to select another date or dates from a pop-up window as shown here:
- Refresh – Click to Refresh the page if system data might have changed since you first opened the report.
- Export CSV – Because of the unique formatting of the Day Report, the Export function does not actually work with it yet, but we may develop this in the future.
- Print – Click to print a copy of this report to a PDF file or a printer connected to your computer.
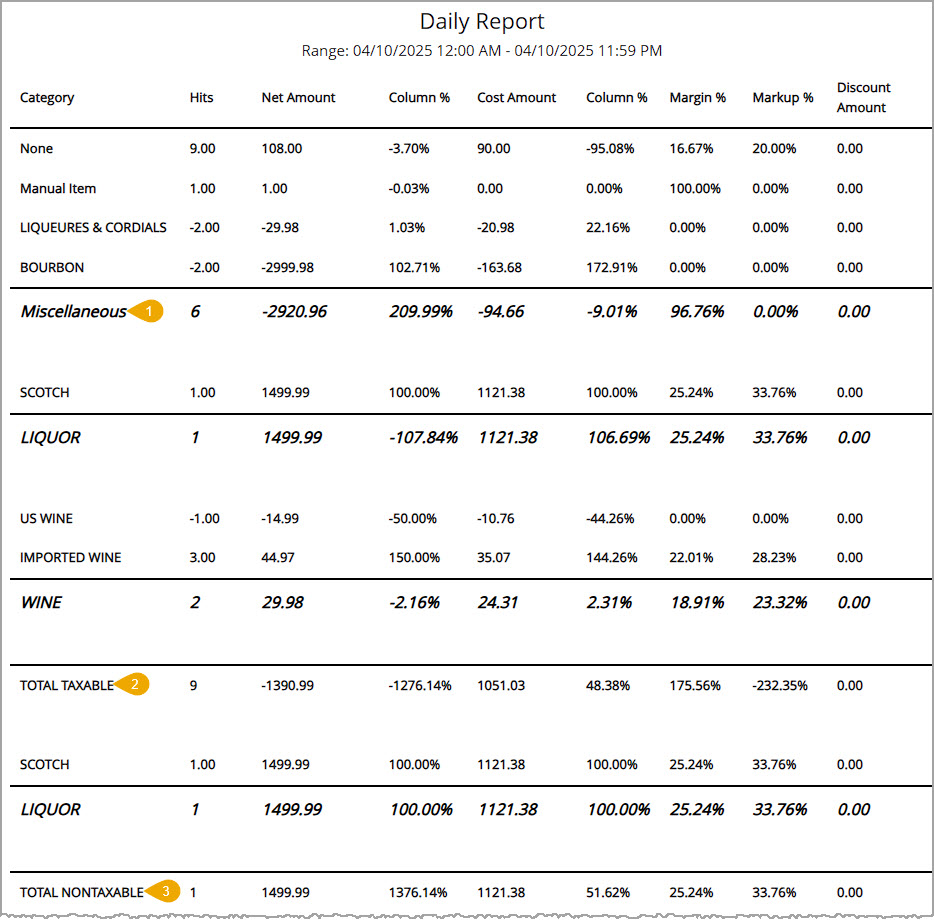
For each of the areas highlighted above, column totals are calculated for the number of taxable sales, dollars earned on taxable sales, your costs, margins, markups, and other relevant information.
- Category Group – This upper area of the Day Report breaks out Categories and then shows the Category Group, subtotaling the sales numbers and percentages, for all Taxable Sales.
- Total Taxable – Below all of your category groupings there is a final Total Taxable line (pictured above) with totals for all your groups.
- Total Nontaxable – In the same way as the taxable sales, all Categories that had non-taxable sales during the date range you've selected are grouped by Category Group, with subtotals for each group. Below the groups there is a final Total Nontaxable with totals for all the groups.
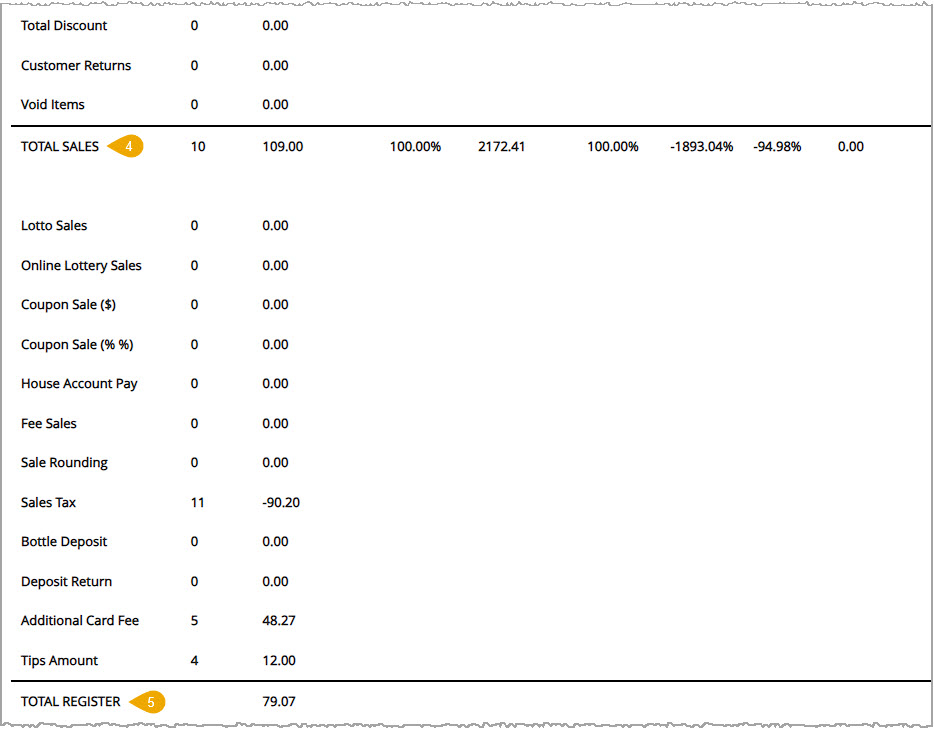
- Total Sales – This area displays column totals for all sales during the date range and includes calculations for any discounts, returns, and voids.
- Total Register – This area displays the total amount of sales plus sales tax, tips, and other similar ledger entries. This is the total amount that should be in the register at the end of the selected date range.
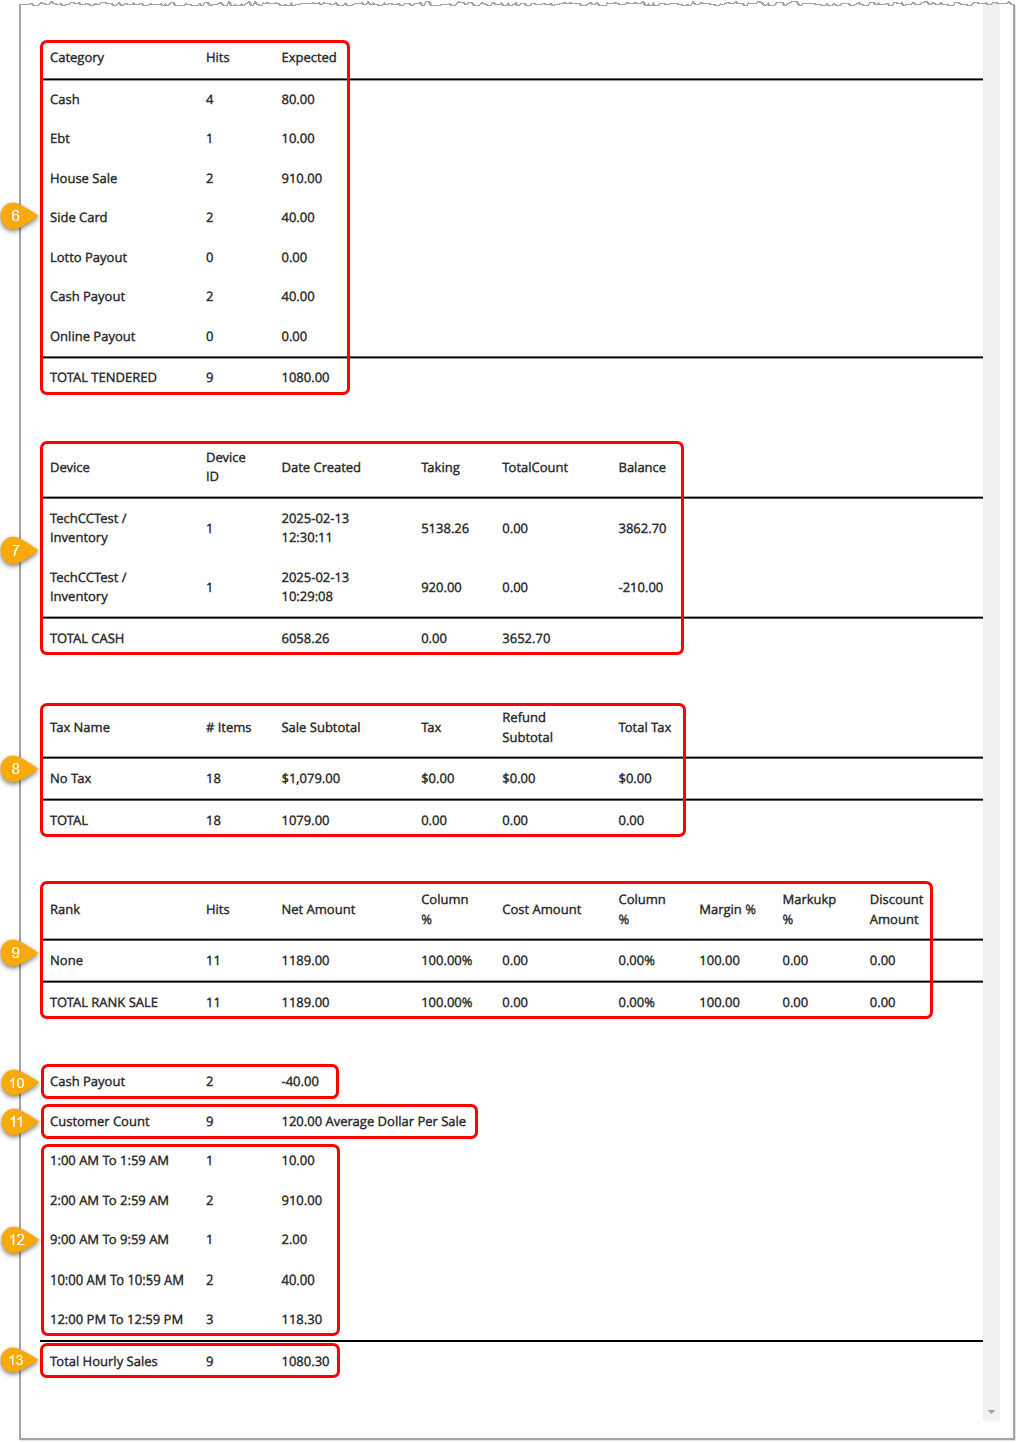
- Total Tendered – This area displays the tender type, the number of times that tender was used, and the dollar value expected for all sales during the date range. The Hits and Expected values are totaled for you. When this number matches the number in Total Register, your register is balanced. Verify that the numbers are correct and that you received this amount in deposit.
- Total Cash – This area displays the cash takings per device with totals for the takings, count, and balance.
- Total Tax – This area displays the sales values for each tax rule including the number of items sold, the dollar amount subtotals, tax amount charged, any refunds, and total taxes after refunds. Each column is totaled for you.
- Total Rank Sale – This area displays the number of sales (Hits), sale amounts, percentage of total sales, cost amounts, percentage of total cost amounts, profit margin percentages, price markup percentages, and discounts of each ranking. Each column is totaled for you.
- Cash Payout – This area displays the total number and total dollar amount of cash paid out of the drawer.
- Customer Count - This area displays the number of customers who made purchases and the average sale dollar amount during the selected date range.
- Hourly Sales – This area displays the number of sales and total dollar value of sales made during each hour of the selected date range. Only hours that had sales are displayed, and if the date range spans multiple days, each hour is totaled across all days.
- Total Hourly Sales – This area displays the total number of sales made and the total dollar amount collected.
- Notes (not shown) – This area shows any Notes saved to transactions, listing the note text, the date and time it was saved, and the Username of the staff member that saved the note.
Related Topics
Guide to the Admin Reports
Frequently Asked Questions
Q: Can I print my reports from the Admin?
A: Yes. If you have a printer connected to your device, you can click the Print button on the top right of the report page to print the current page of the report you are viewing.
Q: I have a question, but I can't find my answer here, how do I get more assistance?
A: You can ask any question at the number below. Contact our 24/7 support team at: (877) 381-4087
Your Admin Dashboard is your hub for keeping your finger on the pulse of your business. Take a look
Your Admin Realtime page gives you a live view of your sales as they come in and has some useful uti
The Reports in the Bottle POS Admin can show you details about all of your data, however you need to
Is this page helpful?
×Help us improve our articles