Dashboard
Your Admin Dashboard is your hub for keeping your finger on the pulse of your business. Take a look
 October 01, 2024
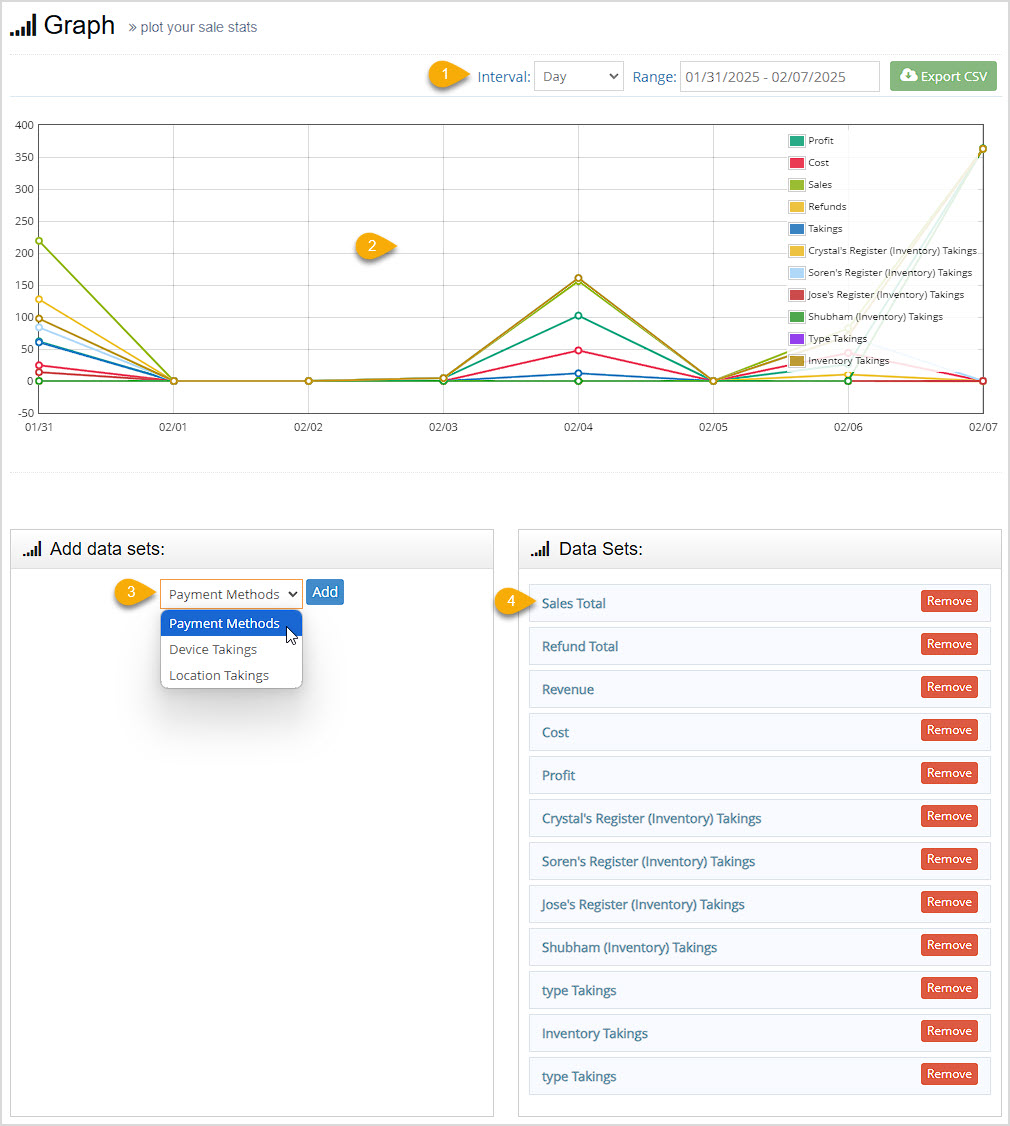
Your Bottle POS Admin Graph page offers a flexible visual tool for your sales and inventory data. Take a look!
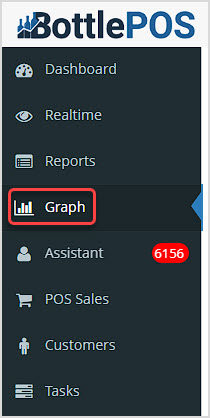
You can get to this part of the system by logging into your Admin and clicking the Graph tab in the upper left.
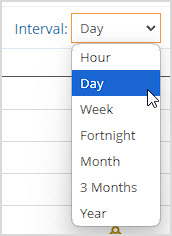
The Graph page allows you to view your sales data however you need. You can set the date Range to the timeframe you want in the upper right. You can also Export the base data (Profit, Cost, Sales, Refunds, and Takings) to a CSV spreadsheet file.
Q: Is the CSV export a graph?
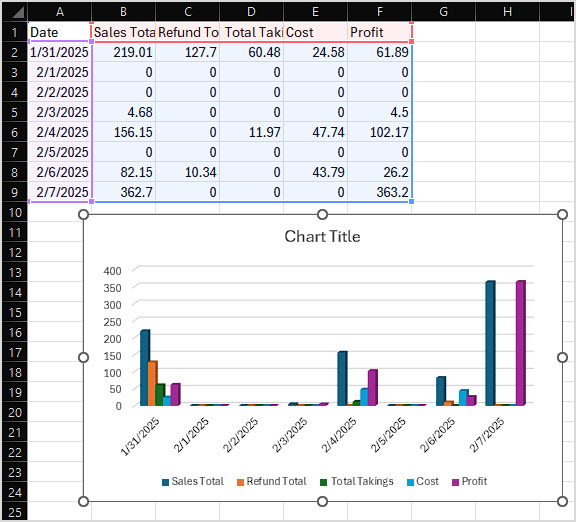
A: No, the data in the graph is exported as a CSV spreadsheet. But any spreadsheet program such as Excel or Google Sheets can take the raw data and turn it into the chart type of your choice, like the example below using the data pictured in this article:
Q: I have a question, but I can't find my answer here, how do I get more assistance?
A: You can ask any question at the number below. Contact our 24/7 support team at: (877) 381-4087
Is this page helpful?
×Help us improve our articles