How can we help?

[{id=194023895042, createdAt=1754473872491, updatedAt=1773153434041, path='managing-timesheet-entries', name='Managing Timesheet Entries', 1='{type=string, value=Managing Timesheet Entries}', 2='{type=string, value=https://help.posnation.com/bottlepos/s/article/Managing-Timesheet-Entries}', 5='{type=option, value={id=1, name='featured_content', order=0, label='Featured Content'}}', 7='{type=string, value=Managing Timesheet Entries}', 8='{type=string, value=
It's common for employees to forget to clock in or out and when that happens you need an easy option to correct their timesheets. Use this article to learn how to make edits to the timesheet entries tracked by your Bottle POS system.
Working With Employee Time Clock Entries
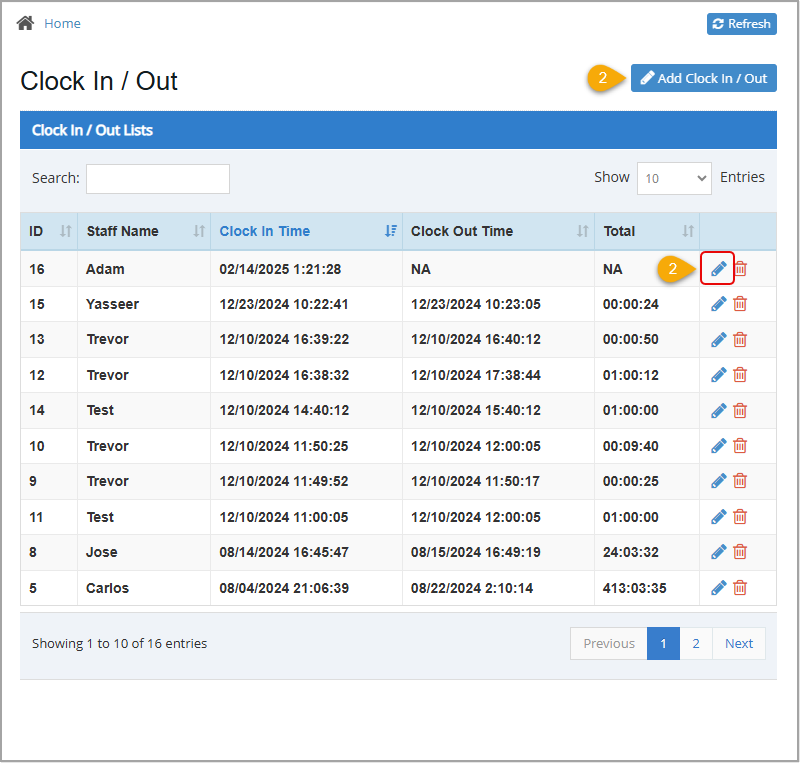
To access the timeclock management system, click Clock In / Out in the Accounting menu of your Admin app. Admin privileges are required to complete the steps in this article.
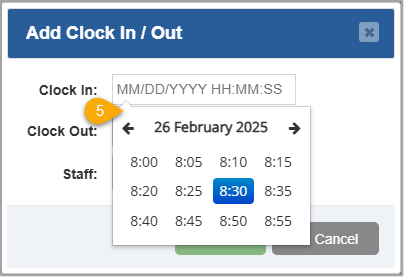
- Add Clock In / Out – Click this button to open the Add Clock In / Out window where you can add a new timeclock entry for an employee. You must have Admin access to complete this task.
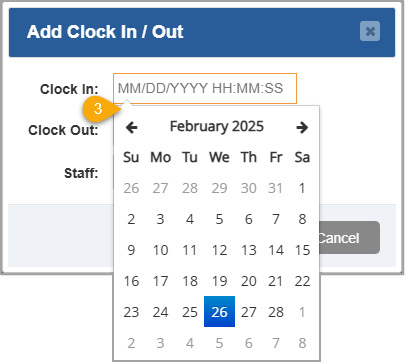
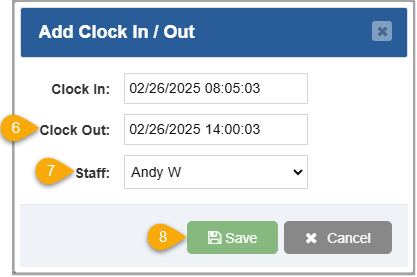
- Clock In – Enter the Clock In Date and Time. You can manually enter these numbers or, as you click into the box, a calendar will open and is followed by two clock (hour and minutes) lists that you can use to select the date and time.
- Clock Out – Enter the Clock Out Date and Time. You can manually enter these numbers or, as you click into the box, a calendar will open and is followed by two clock (hour and minutes) lists that you can use to select the date and time.
- Staff – Select the Staff Member from this drop-list for whom you are creating the entry.
- Save – Click this button to Save your changes for the staff member.
- Cancel – Click this button to Close the window.
- Search – Enter at least the first two letters of an employee's name or a date into this field to filter the results in the data table to matching time clock entries.
- Show Entries – Click and select 10, 25, 50, or 100 to Show that many results per page on your report.
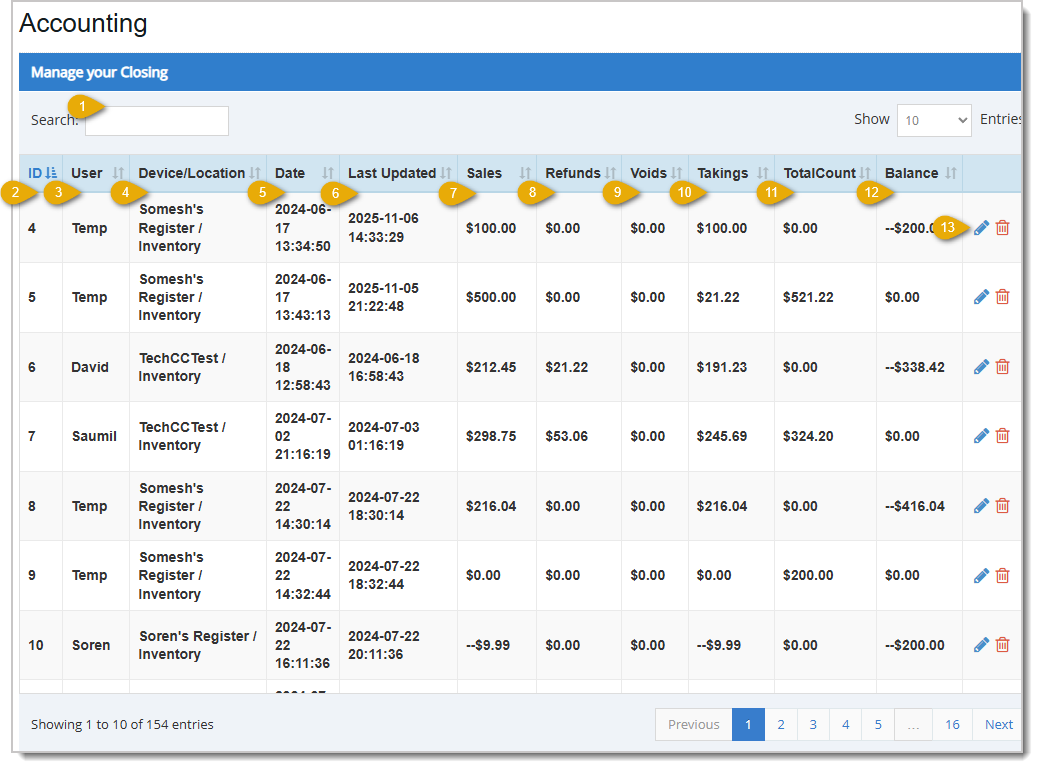
- ID – This column displays the simple ID number the system assigned to each timeclock entry. This is used only for internal purposes.
- Staff Name – This column displays the name of the staff member associated with each time in/out. If a staff name does not exist for a timeclock entry, None displays in the table and will be listed at the top, if you're sorting by Staff Name.
- Clock In Time – This column displays the date and time an employee clocked in. If a clock in time was missed, NA displays in this column and it sorts after the oldest date/time.
- Clock Out Time – This column displays the date and time an employee clocked out. If a clock in time was missed, NA displays in this column and it sorts after the oldest date/time.
- Total – This column displays the duration of each clock in / clock/ out instance. If a clock in or out time was missed, NA displays in the column and sorts above the shortest duration.
- Sort –
 The Sort icon displays in the header row of any sortable column. The currently sorted column displays in blue, as shown on the left. All other sortable columns show this icon in gray, as shown on the right. Click the header of any sortable column to rearrange the table alphabetically or numerically, depending on the information in that column. Click it again to reverse the sort order.
 - Action – Use these icons to edit a timeclock entry or delete it from the table.
- Click the Pencil Icon
 to open the Edit Clock In / Out window. From there you can change the in / out times or employee name.
- Click the Trashcan Icon
 to remove the timeclock entry from the table. You will be asked to confirm the deletion, click the Yes button in the popup window to complete the removal of the entry.
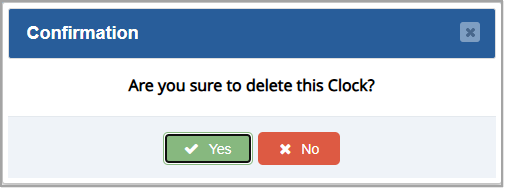
- Click the Pencil Icon
- Previous / Next – Click Previous, Next, or a Page Number to navigate to another page of results.
Adding Or Editing a Timeclock Entry
- In the Admin app, go to Accounting > Clock In/Out. The Clock In / Out page will load.
- Click the Add Clock In / Out button to add an entry or click the Pencil Icon next to an entry you want to edit. The Add Clock In / Out window or Edit Clock In / Out window will open.
The remaining steps are the same whether you are adding or editing an entry but the images show the Add Clock In / Out window.
- Click in the Clock In field and select the clock-in date from the calendar. The calendar will change to hour selection.
- Select the hour the employee clocked in. The hour selection will change to minutes.
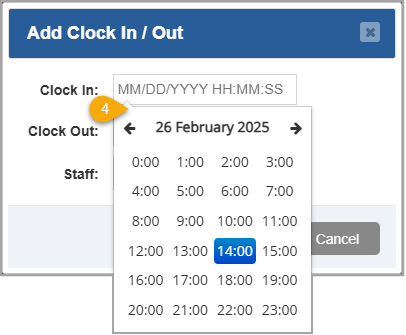
- Select the minutes after the hour when the employee clocked in. The time selection window will close and you'll see your selections in the Clock In field.
- Repeat steps 3 through 5 in the Clock Out field. Both a clock in and clock out time are required when adding a timeclock entry for an employee.
- Select the staff member you are adding a timecard entry for in the Staff drop-list.
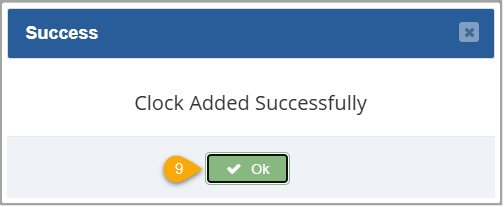
- Click the Save button. A confirmation message will pop up.
- Click OK to confirm the new timeclock entry.
Related Topics
How to Create and Manage Customers in the Admin
Frequently Asked Questions
Q: How can our staff members clock in through the POS?
A: You can clock in through the register by clicking Clock In/Out in the upper right of the screen. For more information on how to use the timesheet features from the Register, review the How to Clock In & Out article linked above.
Q: I have a question, but I can't find my answer here, how do I get more assistance?
A: You can ask any question at the number below. Contact our 24/7 support team at: (877) 381-4087
}', 9='{type=list, value=[{id=1, name='bottle_pos', order=0, label='Bottle POS'}]}', 10='{type=number, value=0}', 15='{type=number, value=0}', 18='{type=list, value=[{id=194026309000, name='Accounting'}, {id=209031817896, name='Getting Started'}]}', 19='{type=string, value=Managing Timesheet Entries}', 20='{type=number, value=2}', 21='{type=number, value=0}', 22='{type=string, value=[{"brand":"bottle_pos","comments":[{"date":"2025-10-06","time":"10:48:28","rowId":194023895042,"comment":"Loved it ......"}]}]}'}, {id=194023895043, createdAt=1754473872492, updatedAt=1762537049026, path='how-to-view-and-manage-closing-info-for-previous-shifts', name='How to View and Manage Closing Info for Previous Shifts', 1='{type=string, value=How to View and Manage Closing Info for Previous Shifts}', 2='{type=string, value=https://help.posnation.com/bottlepos/s/article/How-to-View-and-Manage-Closing-Info-for-Previous-Shifts}', 18='{type=list, value=[{id=194026309000, name='Accounting'}]}', 19='{type=string, value=How to View and Manage Closing Info for Previous Shifts}', 5='{type=option, value={id=2, name='recommended_extra', order=1, label='Recommended Extra'}}', 7='{type=string, value=How to View and Manage Closing Info for Previous Shifts}', 8='{type=string, value=Use this article to learn how to view and manage the drawer count information for a previously closed shift. This allows you to verify the information from any previous shift and correct your drawer count if needed.

To access and view the drawer count information for a closed shift, select Closing in the Accounting menu in your Admin system. Admin privileges are required to complete the steps in this article.
The Sort icon ![]() displays in the header row of any sortable column. The currently sorted column displays in blue, as shown in the ID column above. All other sortable columns show this icon in gray. Click the header of any sortable column to sort the table alphabetically or numerically, depending on the information in that column. Click it again to reverse the sort order.
displays in the header row of any sortable column. The currently sorted column displays in blue, as shown in the ID column above. All other sortable columns show this icon in gray. Click the header of any sortable column to sort the table alphabetically or numerically, depending on the information in that column. Click it again to reverse the sort order.
- Search - Enter any keyword or numeric value to Search for a specific row in the data table. For example, you might search by the device or the name of the employee who closed the register. The software starts searching for matches as soon as you start typing.
- ID - This column displays the ID number assigned to the Closing entry by the system. This is used only for internal purposes. If your window is less than full width you will see a + Icon here you can use to expand the row and see data for columns that don't have room to display in the table.
- User - This column displays the Username of the staff member associated with each closing drawer count.
- Device/Location - This column displays the name of the Device and the Location of the device.
- Date - This column displays the Date and Time a drawer was closed.
- Last Updated - This column displays the date and time of the last update to the Closing entry.
- Sales - This column displays the total dollar amount sold for the Closing entry.
- Refunds - This column displays the total dollar amount of any Refunds for the Closing entry.
- Voids - This column displays the total dollar amount of Voids for the Closing entry.
- Takings - This column displays the total dollar amount of Sales remaining after deducting Refunds and Voids for the Closing entry.
- TotalCount - This column displays the counted drawer amount.
- Balance - This column displays the over / under amount counted at the drawer. $0 indicates the drawer count was equal to what the system expects.
- Action - Use these icons to edit a timeclock entry or delete it from the table.
- Click the Pencil icon to open the Edit Closing window. From there you can change the details of the closing.
- Click the Trashcan icon to delete the closing. You will be asked to confirm that you want it deleted.
- Click the Pencil icon
When editing a closing, you are not able to edit the User, Device/Location, and Date. Editable fields are Sales, Refunds, Voids, Takings, TotalCount, and Balance.
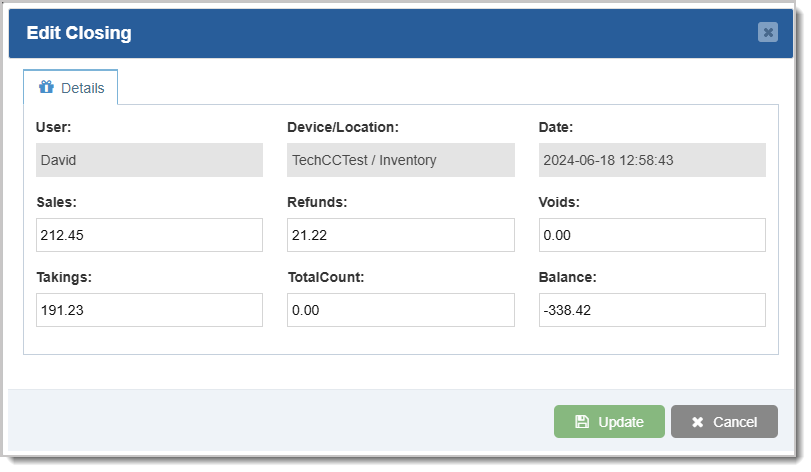
Click the Update button when your changes are in place.
Related Topics
Day Report
(Admin Reports)
Frequently Asked Questions
Q: Can I create a new shift close entry from Admin?
A: No. To create a new entry you must close the shift in the Register.
Q: I have a question, but I can't find my answer here, how do I get more assistance?
A: You can ask any question at the number below. Contact our 24/7 support team at: (877) 381-4087
}', 9='{type=list, value=[{id=1, name='bottle_pos', order=0, label='Bottle POS'}]}', 10='{type=number, value=0}', 15='{type=number, value=0}'}, {id=194023895044, createdAt=1754473872493, updatedAt=1774991595339, path='how-to-create-and-manage-expenses', name='How to Create and Manage Expenses', 1='{type=string, value=How to Create and Manage Expenses}', 2='{type=string, value=https://help.posnation.com/bottlepos/s/article/How-to-Create-and-Manage-Expenses}', 18='{type=list, value=[{id=194026309000, name='Accounting'}]}', 19='{type=string, value=How to Create and Manage Expenses}', 20='{type=number, value=0}', 5='{type=option, value={id=1, name='featured_content', order=0, label='Featured Content'}}', 21='{type=number, value=1}', 7='{type=string, value=How to Create and Manage Expenses}', 8='{type=string, value=This article will explain how to create and manage your Expenses from the Bottle POS and the Admin. Expenses allow you to create unique payouts to keep track of various business operations such as cash drops or repairs.
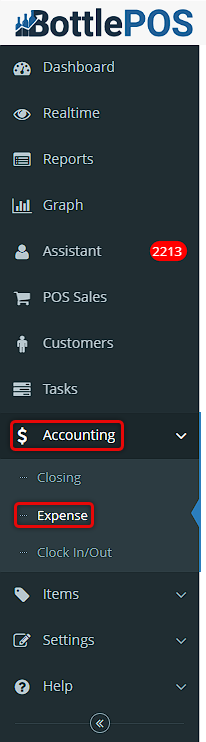
To get started, login to the Admin app. You can get to the Expense section of the Admin by clicking on Accounting, and then Expense. The Expense section is where you can create new expenses and manage existing ones.

There are three main areas you will want to work with for your Expenses: you'll want to define your Expense Types, set up Vendors as they relate to expenses, and you can create Categories for your expenses if you like. The Manage Expense Types, Manage Vendor, and Manage Category buttons in the upper right will let you work in those areas.
- You can use Expense Types to organize your expenses by major areas. This is a higher 'level' of organization than you'll use with Expense Categories and might include things like Operations, Inventory (together with Vendors, below), and Office. Click on the Manage Expense Types button and in the window that opens, you can click the Add button to create new ones, or click the Pencil icon to edit existing ones. If needed, you can click the Trashcan icon to delete any expense types you no longer need.

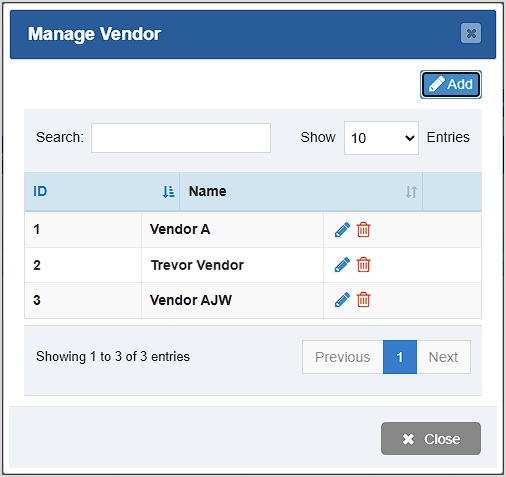
- Vendors are optional and you can add one to an expense if there is a specific vendor associated with the payout. You won't need to use this for your normal inventory suppliers: this area would be for small payouts to local vendors you just pay on the spot. Click the Manage Vendor button to work with your Vendors, the Manage Vendor window will open for you. You can create new ones with the Add button, edit vendors in your list with the Pencil icon, or delete them if needed with the Trashcan icon. An example of a Vendor might be a Boy Scout troop fundraiser selling candy bars you purchase and resell in your store.
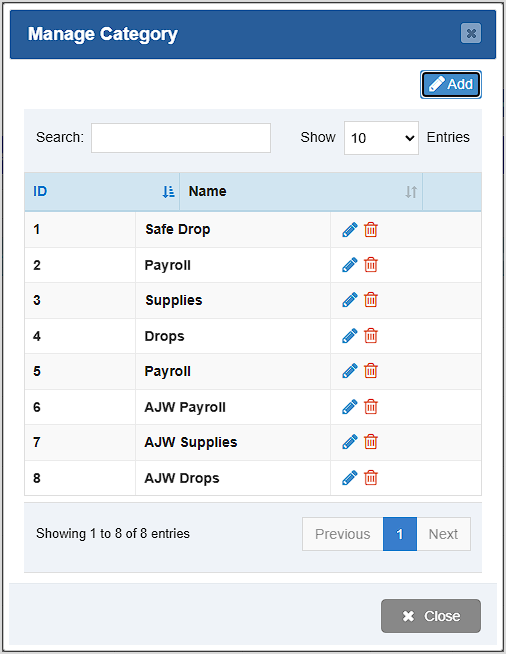
- Categories are an optional level you can use to further organize your expenses. You can use these however you like, but they are more specific than your Expense Types and might include things like petty cash used for an Employee Party, purchases of Supplies, etc. Click the Manage Category button to open the Manage Category window. You can click the Add button to add new Expense Categories, click the Pencil icon to edit a saved category, or click the Trashcan icon to delete a category. You'll be asked to confirm deletion.
Adding Expenses
Once you have set up your expense types, vendors, and categories, click the Add button on the top right of the screen to create a new Expense from the Admin. The Add Expense window will open.
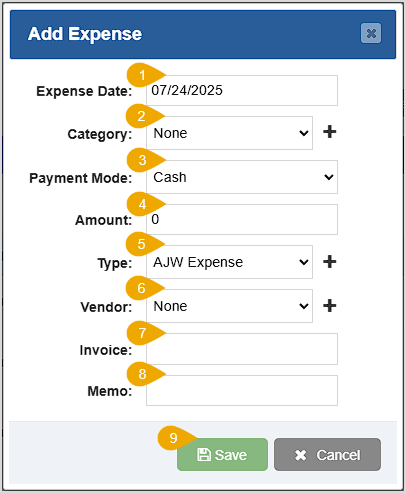
- Expense Date – Enter the date of the expense.
- Category – Select the expense category from the drop-list, if applicable. You can click the Plus icon to create a new Expense Category, if needed.
- Payment Mode – Use this drop-list to select the tender used for the expense.
- Amount – Enter the expense dollar amount in this field.
- Type – Select the expense type from this drop-list, if applicable. You can click the Plus icon to create a new Expense Type, if needed.
- Vendor – Select the vendor associated with the expense from this drop-list, if applicable. You can click the Plus icon to create a new Vendor, if needed.
- Invoice – An optional field where you can enter an invoice number.
- Memo – An optional field where you can enter notes.
- Save – Be sure to click the Save button when you're finished to save the new expense.
Please Note: You can also create an expense directly from the POS by clicking on the Payout button on the Register screen.
Related Topics
How to Create and Manage Customers in the Admin
Frequently Asked Questions
Q: Will cash expenses affect my drawer count?
A: Yes, any cash payout you perform will remove that amount from the expected cash in your drawer.
Q: Do expenses show in my reports?
A: Yes, expenses will appear in your reports as a payout of that expense type.
Q: I have a question, but I can't find my answer here, how do I get more assistance?
A: You can ask any question at the number below. Contact our 24/7 support team at: (877) 381-4087
}', 9='{type=list, value=[{id=1, name='bottle_pos', order=0, label='Bottle POS'}]}', 10='{type=number, value=0}', 15='{type=number, value=0}'}, {id=194023895045, createdAt=1754473872494, updatedAt=1783205811199, path='dashboard', name='Dashboard', 1='{type=string, value=Dashboard}', 18='{type=list, value=[{id=194026308997, name='Admin Reports'}, {id=209031817896, name='Getting Started'}]}', 20='{type=number, value=1}', 5='{type=option, value={id=1, name='featured_content', order=0, label='Featured Content'}}', 21='{type=number, value=0}', 7='{type=string, value=Dashboard}', 8='{type=string, value=Your Admin Dashboard is your hub for keeping your finger on the pulse of your business. Take a look at how it breaks out sales and inventory data for you.
Whenever you log into your Admin, your Dashboard page will load for you so you can see what's going on at a glance with your store. From anywhere in the Admin you can get back to your Dashboard with the link in the upper left.
Using Your Admin Dashboard
Your Dashboard offers a wealth of instant information in an attractively laid-out page. Here is what each area has to offer:
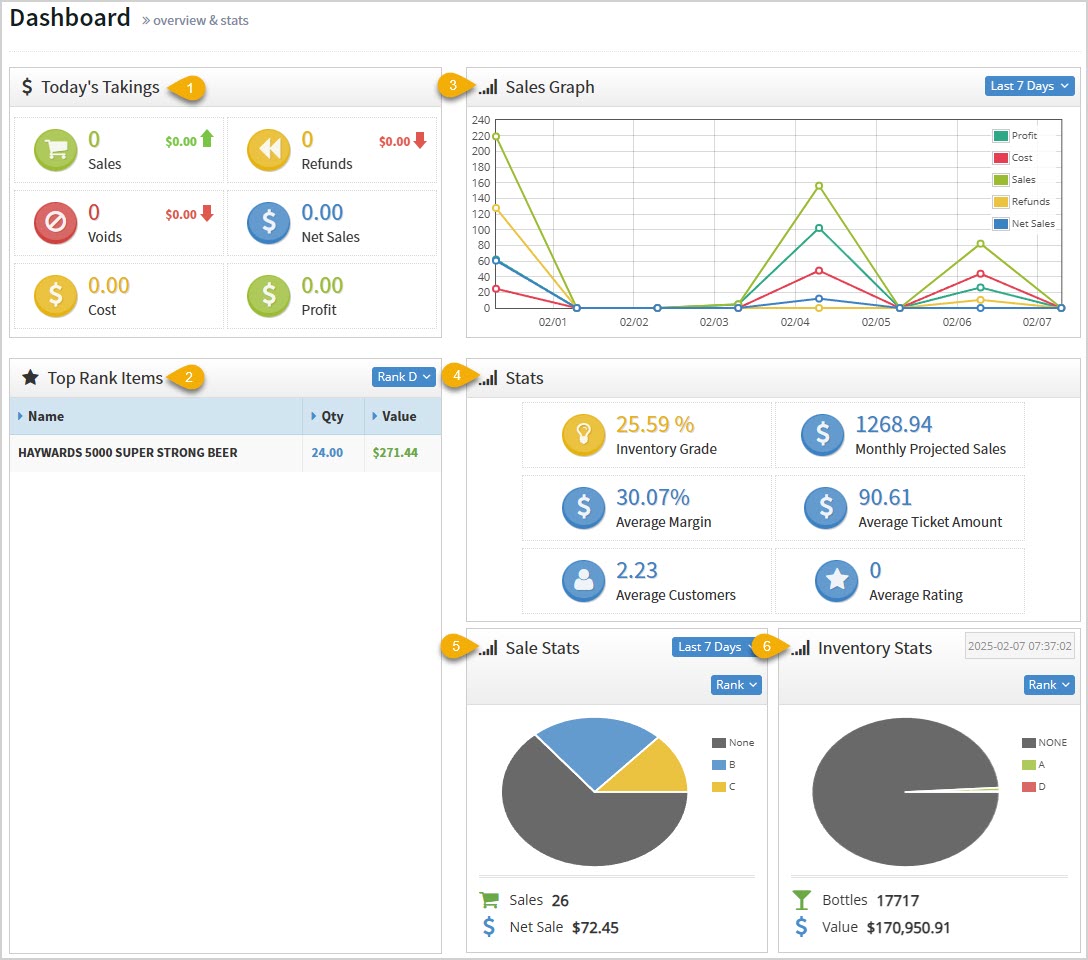
- Today's Takings – This area displays the following data across all of your stores for you:
- The total number of Sales. It also shows the total dollar amount of your sales.
- The total number of Refunds. It also shows you the total dollar amount of your refunds.
- The total number of Voids. It also shows you the total dollar amount of your voided transactions.
- The total dollar amount of Net Sales. These are your sales totals after Refunds and Voids have been removed.
- The total Cost you paid for sold items.
- The total dollar amount of your Profits.
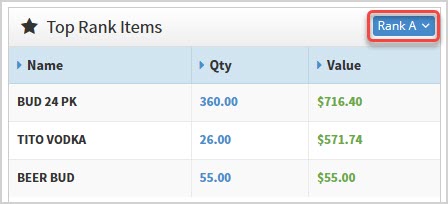
- Top Rank Items – This area allows you to filter by the four different Ranks (A, B, C, and D) using the drop-list in the upper right and see which items in each Rank are your top sellers. In the example above, we see Rank D items, and we're early in the day so there's only one. Below we see Rank A items. Rank A is the top 20% of your sales, Rank B is the middle 60% of your sales, Rank C inventory falls into the bottom 20% of your sales, and Rank D inventory has no sales history. The table shows you the item Name, the Quantity sold, and the total dollar Value of the sold items.
- Sales Graph – By default you'll see a line graph of the Last 7 Days of your sales, and you can change the time range with the drop-list in the upper right. The Sales Graph shows the total dollar value of your Sales transactions, your Net Sales, the Cost of all your items, the dollar amount of your Refunds, and your Profit.
- Stats – The Bottle POS keeps constant track of your inventory and sales performance, and the Stats area offers you the following key data points:
- Inventory Grade – This is calculated based on the spread of Ranked items across your inventory. If you have a higher balance of the higher ranks, your inventory will be graded higher. The higher your percentage score in this area, the better your inventory is performing.
- Monthly Projected Sales – Based on your sales history, this is the system's prediction on total sales for the month.
- Average Margin – This is the average profit margin on items you have sold.
- Average Ticket Amount – This is the average individual transaction Total across all of your sales transactions for the period.
- Average Customers – This is the average of the number of daily customers per store.
- Average Rating – This is the average number of stars given to your store from the customer-facing display, if you have that setting active.
- Sale Stats – This pie chart breaks down your Total Sales across all item Ranks in the default view for your inventory, and also shows any unranked inventory. By default we see the Last 7 Days, but you can use the drop-list in the upper right to adjust the date range. With all charts in this area you can hover over a section or click on it to see details. You can also adjust the Mode of the chart to any of the following:
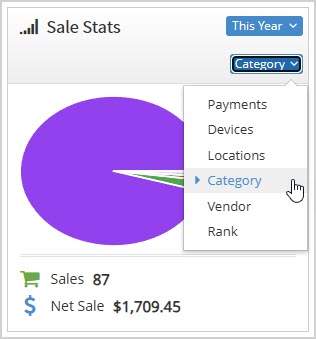
- Payments – This will break down sales dollars for the period by Tender type.
- Devices – This will show each Device / Register that had sales during the period and how much for each.
- Locations – For the current store, this will show sales by Locations within the store.
- Category – This will break out dollar totals by the Categories you've created.
- Vendor – You will see sales totals for each of your Suppliers (vendors) for the period.
- Rank – This chart will show you sales by item Rank, including any items you haven't ranked yet. Again, Rank A is the top 20% of your sales, Rank B is the middle 60% of your sales, Rank C inventory falls into the bottom 20% of your sales, and Rank D inventory has no sales history.
- Inventory Stats – As with the Sale Stats and the Sales Graph, with all charts in this area you can hover over a section or click on it to see details. This chart starts with the inventory status at the current time, but you can click the Date area to see historical inventory quantities and values for previous dates. This area shows you your total number of items (Bottles), their total dollar Value, and breaks down your inventory in the following ways:
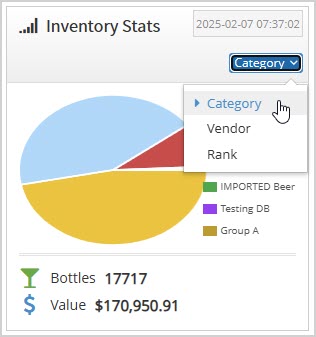
- Category – See your inventory quantities for your Categories.
- Vendor – See the quantities and value of your inventory broken down by Suppliers.
- Rank – See how many unranked items you have and the quantities for the four Ranks for your inventory.
Related Topics
Frequently Asked Questions
Q: Can I print or export Dashboard data?
A: From the Dashboard, you cannot print or export, but the Admin Reports have that ability and go into more detail than the Dashboard.
Q: I have a question, but I can't find my answer here, how do I get more assistance?
A: You can ask any question at the number below. Contact our 24/7 support team at: (877) 381-4087
Your Admin Realtime page gives you a live view of your sales as they come in and has some useful utility for you, take a look!

You can get to this part of the system by logging into your Admin and clicking on Realtime in the upper left.
Using the Realtime Page
Your Realtime page gives you instant view of system events such as transactions as they happen, as well as messaging functionality for your active Devices.
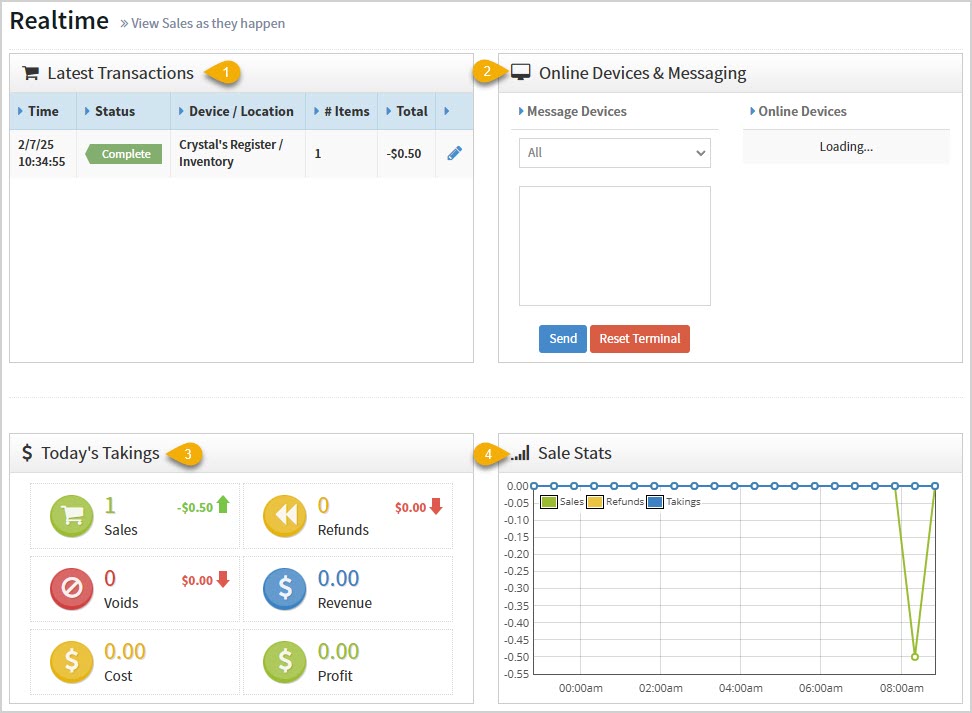
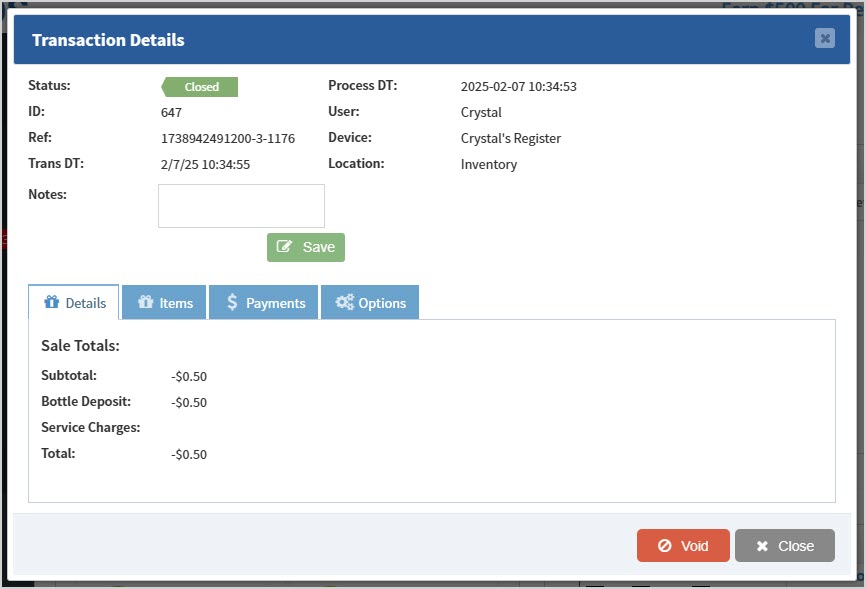
- Latest Transactions – You can see a chronological list of recent transactions here with details on Time, Status, Device & Location, Number of Items, Total, and a Pencil Icon you can click to view the Transaction's Details.
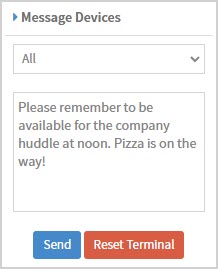
- Online Devices & Messaging – This is a utility you can use to see all Devices online across your stores for the POS. You can also send messages to specific devices or to All devices that will pop up on the Register for your sales clerks. The Reset Terminal function logs out the POS and sends it back to the lock screen (it is recommended not to use this function unless directed to do so by the Support team).
- Today's Takings – This area displays the following data across all of your stores for you:
- The total number of Sales. It also shows the total dollar amount of your sales.
- The total number of Refunds. It also shows you the total dollar amount of your refunds.
- The total number of Voids. It also shows you the total dollar amount of your voids.
- The total dollar amount of Revenues.
- The total Cost dollar amount of sold items.
- And the total dollar amount of your Profits.
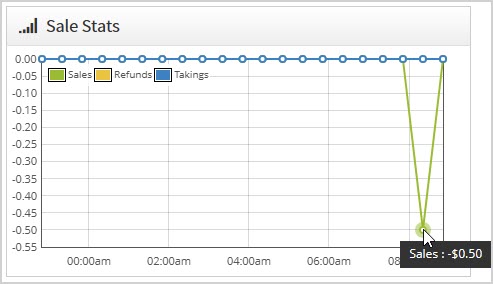
- Sale Stats – This area shows the most recent hours of sales and offers you Sales, Refunds, and Takings data if you hover your over a sale or click on it to see details.
Related Topics
Frequently Asked Questions
Q: Can I view a longer time range in the Sale Stats?
A: Not on the Realtime page, but in the Register the Sales page shows a longer time range, and in the Admin Reports, the Sales report can display any time range you need.
Q: I have a question, but I can't find my answer here, how do I get more assistance?
A: You can ask any question at the number below. Contact our 24/7 support team at: (877) 381-4087
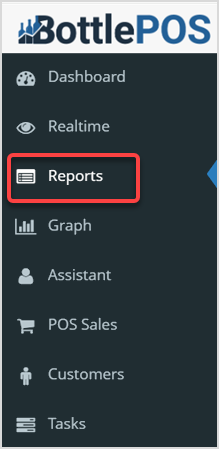
The Reports in the Bottle POS Admin can show you details about all of your data, however you need to see it. They are super easy to use and highly informative, take a look!
To get to this part of the system, sign in to your Admin. Click Reports in the upper left to view the reports detailed below.
The Admin Reports
The Admin Reports section offers a wide variety of reports to give you data on all aspects of your store. This article will give you an overview of the reports and links to more detailed articles for each one. They all follow the same easy-to-use format:
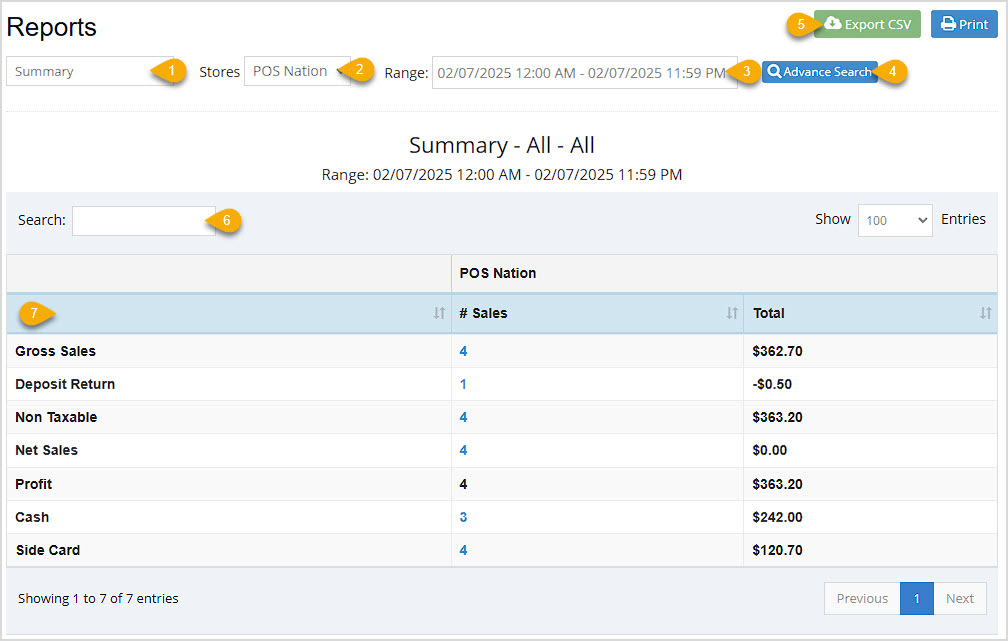
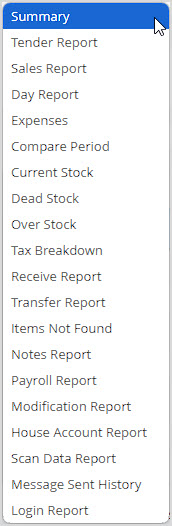
- Report Picker – Your master list of Admin Reports, click to open the list and select the one you want.
- Store Filter – If you have multiple stores, in some reports you'll be able to see results for individual stores with this filter.
- Date Range – Most reports allow you to filter for the date range you want. The Compare Periods report will let you look at two periods you define to compare data.
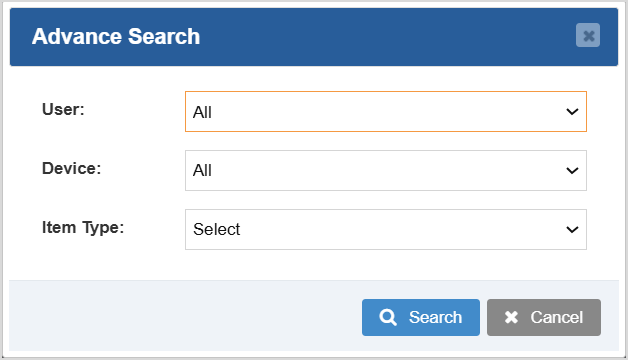
- Advance Search – This area allows for customized filtering based on the data for the report. This functionality is not on all reports.
- Export & Print – Export all of a report's data to a CSV spreadsheet file, or Print the current page of the report.
- Search – You can search by keyword or numeric value for any data in the report.
- Data Table – The data in each report is unique, so the columns you'll see will all offer data specific to the report. You can click the column headers to sort / reverse sort, and sometimes the data is linked to more detailed views such as a Transaction Details window or something similar.
Reports Overview
Summary Report
A summary of your sales displaying data for the current day, by default.
- This report can be filtered by your different Stores. When viewing a Date Range with more than one Shift, the report can be filtered by Shift.
- Advance Search allows you to filter by User, Device, and Item Type.
- The Data Table displays Net Sales, Gross Sales, Non-Taxable sales, Profit, Deposit Return, and sales by Tender type.
- For more details, click here: Summary Report
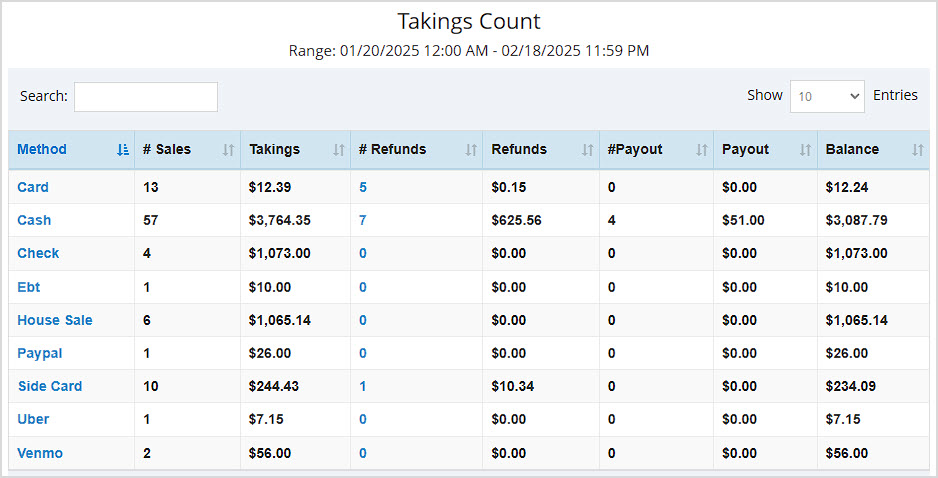
Tender Report
A breakdown of your sales by Tender type. Defaults to the current day's data.
- This report can be filtered by your different Takings Count (shown below), Location Takings, Device Takings, and User Takings.
- The Data Table displays (for most filters) Number of Sales, Takings dollar amount, Number of Refunds, Refunds dollar amount, Number of Payouts, Payouts dollar amount, and the adjusted Balance (total) for each line item.
- For more details, click here: Tender Report
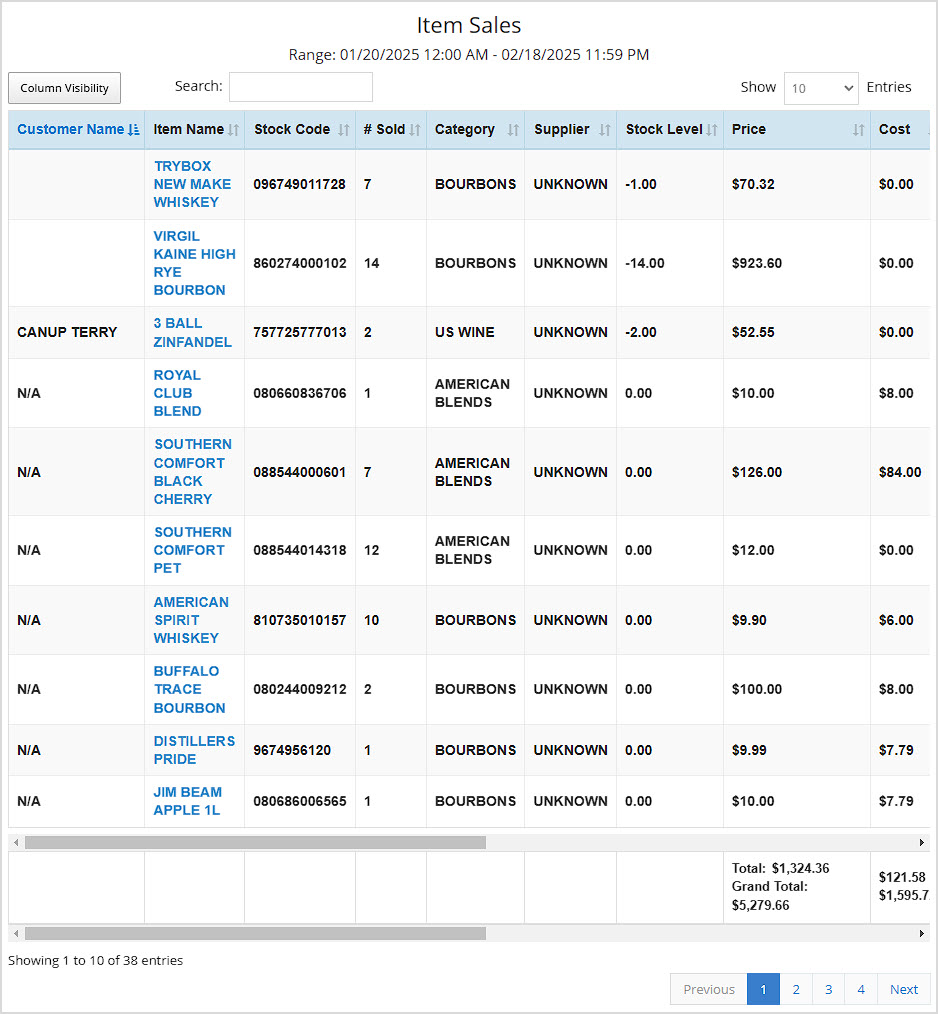
Sales Report
A summary of your Sales displaying data for the current day, by default.
- This report can be filtered by your different Item Sales (Shown below: offers a unique data table showing Customer Name, Item Name, Stock Code, Number Sold, Category, Supplier, Stock Level, Price, Cost, and Profit, other filters show identical table data described below), Supplier Sales, Category Sales, Rank Sales, Category Group Sales, and Item Sizes.
- Advance Search is available only in the Item Sales view and allows you to filter by Customer, Supplier, Category, User, Device, and Item Type.
- The Data Table for all views except Item Sales (detailed above) displays Name, Number Sold, Price, Cost, Profit, Margin %, Markup, Discounts, Total, Number Refunded, Total, and Balance.
- For more details, click here: Sales Report
Day Report
A unique report that generates for the current day when selected.
- This report has no filters.
- The report shows tables for Taxable / Nontaxable, Discounts, Return, & Voids, Item Type Sales, Sales by Tender, Sales by Device, Sales Tax, and Ranked Sales.
- The data table offers details on Cash Payout, Customer Count, and Hourly Sales.
- For more details, click here: Day Report
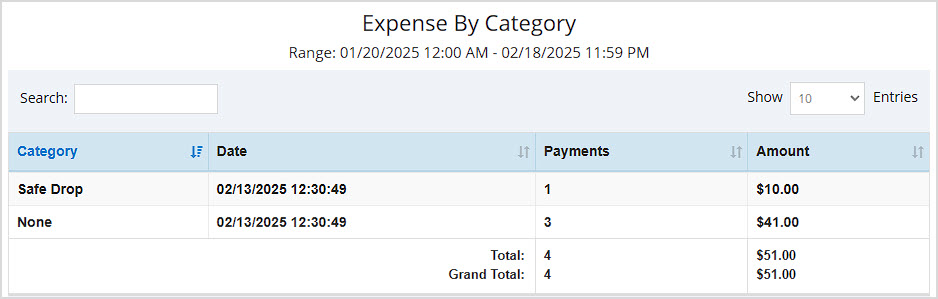
Expenses Report
A summary of your expenses displaying data for the current day, by default.
- The report can be filtered by Category (shown below), Vendor, Device, or All.
- The Data Table displays Category / Vendor / Device (or all three in the All view), Date, number of Payments, and the total dollar Amount.
- For more details, click here: Expenses Report
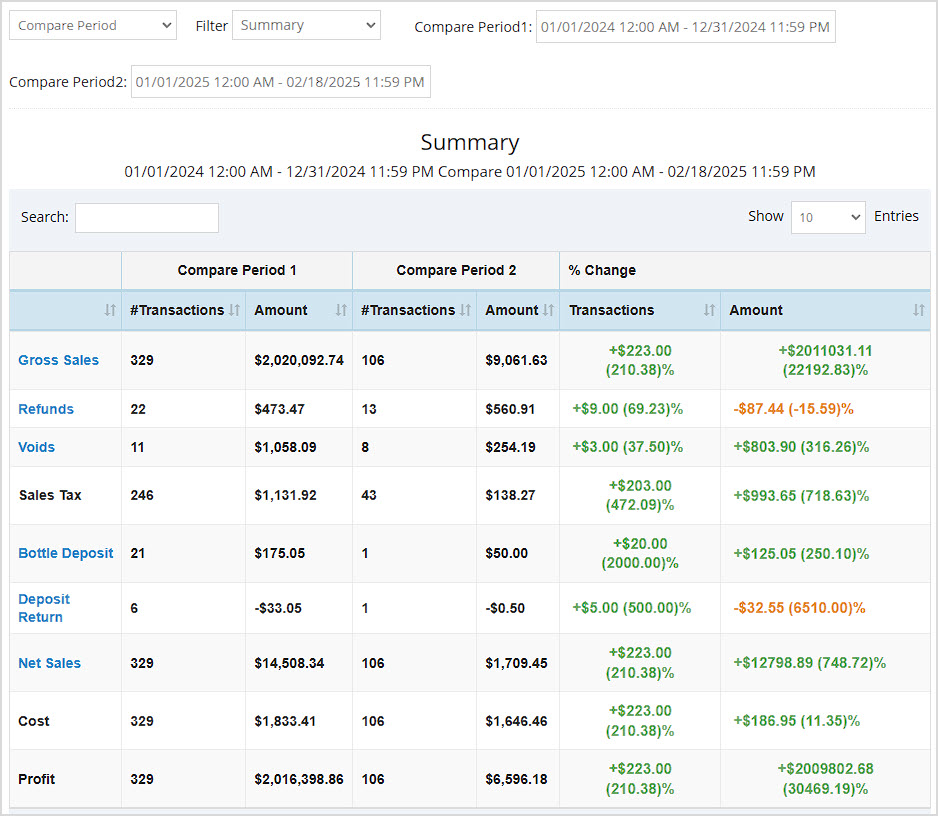
Compare Period Report
This allows you to see the number of sales and dollar amount for different sales data points compared between two different time periods you can define.
- It can be filtered by Summary (pictured below, showing Gross Sales, Refunds, Voids, Sales Tax, Bottle Deposit, Deposit Return, Net Sales, Cost, and Profit), Item Sales, Supplier Sales, Category Sales, Supplier Sales, Expense Categories, and Expense Vendor.
- The Data Table displays the filter item type name and the Number of Transactions / Dollar Amount for each of the two periods you define, then shows the Percentage change for the Number of Transactions / Dollar Amount.
- For more details, click here: Compare Period Report
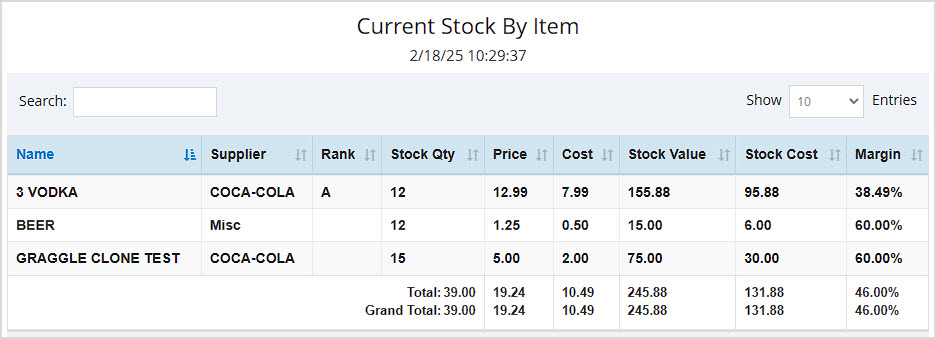
Current Stock Report
A summary of your inventory quantities and values as of the present time for the store you're currently logged into.
- This report can be filtered by Item (shown below), Category, Category Group, Supplier, and Rank.
- The Data Table displays Name, Supplier (Item View), Rank (Item View), Stock Quantity, Price, Cost, Stock Value, Stock Cost, and Margin.
- For more details, click here: Summary Report
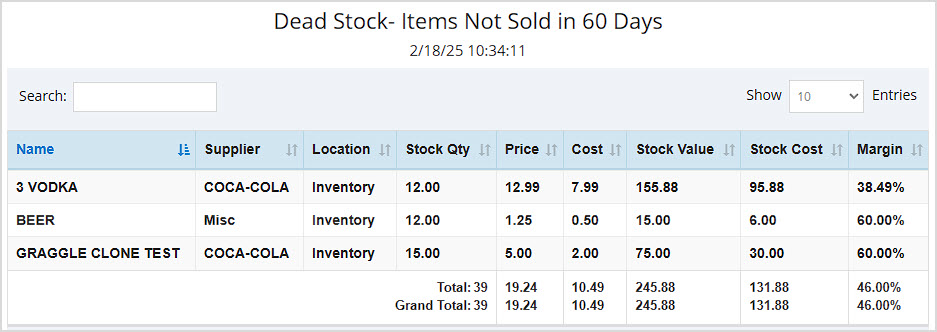
Dead Stock Report
This report shows Items Not Sold over different time frames.
- This report can be filtered by preset numbers of days (30, 60 (shown below), 90, etc.)
- The Data Table displays the item Name, Supplier, Location, Stock Quantity, Price, Cost, Stock Value, Stock Cost, and Margin.
- For more details, click here: Dead Stock Report
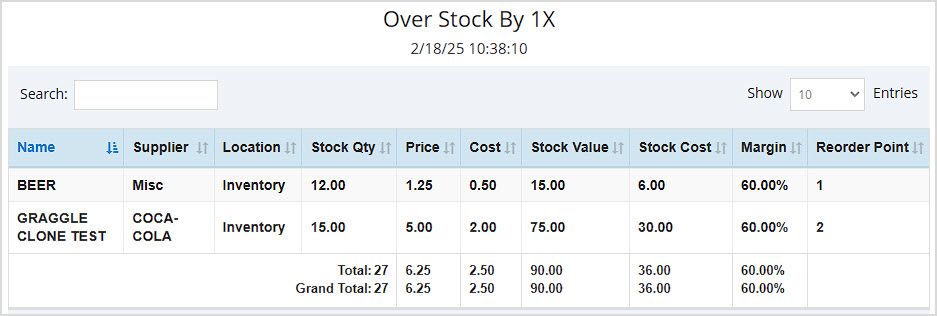
Over Stock Report
This report lets you see to what degree your inventory is overstocked and which items are overstocked.
- The results can be filtered by how many multiples the stock is over, e.g. 1x (shown below), 2x, and ranging up to 5x.
- The Data Table displays item Name, Supplier, Location, Stock Quantity, Price, Cost, Stock Value, Stock Cost, Margin, and Reorder Point.
- For more details, click here: Over Stock Report
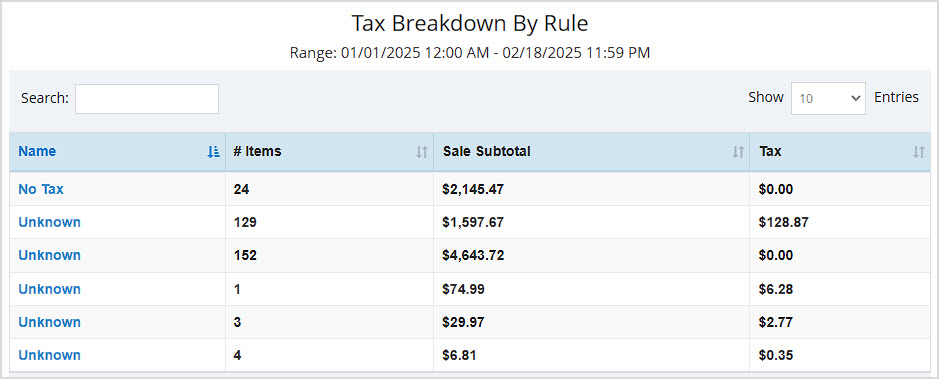
Tax Breakdown Report
This report summarizes your taxes by Tax Rule for the period you're viewing.
- This report can be filtered by your different Tax Rules (shown below) or your Tax Names.
- The Data Table displays Name, Number of Items, the Sale Subtotal, and Tax amount.
- For more details, click here: Tax Breakdown Report
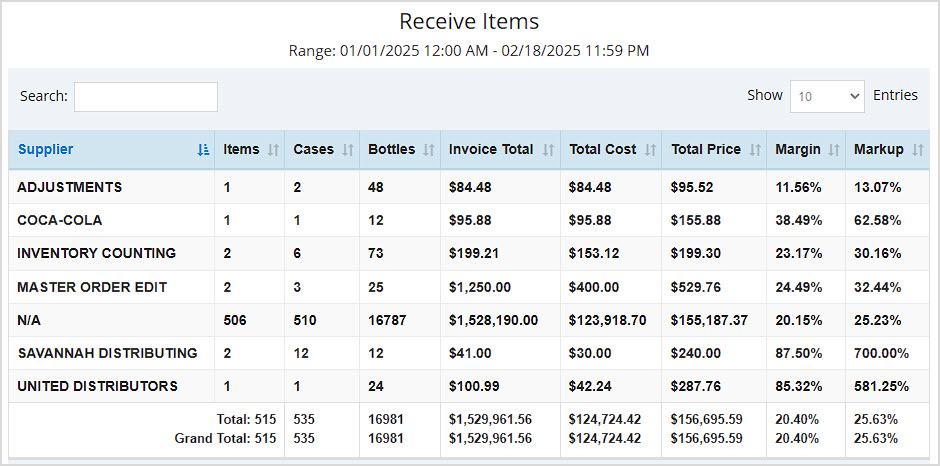
Receive Report
This report breaks down important data about inventory you have received in whatever date range you choose.
- This report can be filtered by Supplier (shown below), Items, and Category.
- The Data Table for the Supplier and Category views display Supplier, Items, Cases, Bottles, Invoice Total, Total Cost, Total Price, Margin, and Markup, with Totals for all columns.
- The Data Table for the Items view shows item Name, Supplier, Invoice Total, Invoice Number, and item Quantity.
- For more details, click here: Receive Report
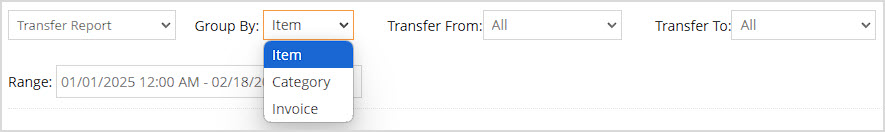
Transfer Report
This report gives key information about all inventory Transfers you have done between your stores. If you don't have multiple stores in the Bottle POS you won't need this report.
- You can filter by Item (shown below), Category, or Invoice. You can also filter by From and To stores where you did the Transfers.
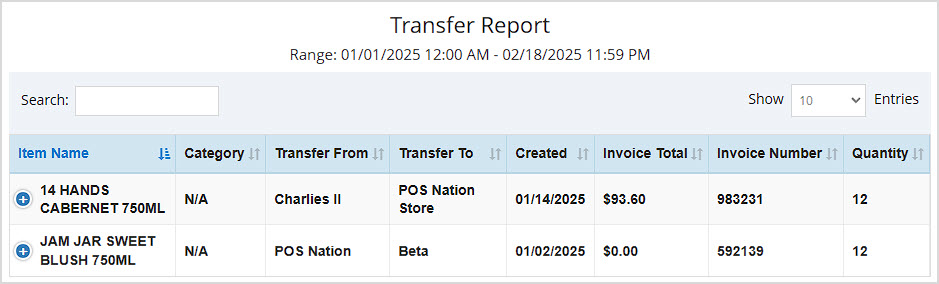
- The Data Table for the Item view displays Item Name, Category, Transfer From, Transfer To, date Created, Invoice Total, Invoice Number, and Quantity transferred.
- The Data Table for the Category view displays Item Category, Transfer From, Transfer To, Invoice Total, Quantity transferred, and the Total Cost.
- The Data Table for the Invoice view displays date Created, Transfer From, Transfer To, Items, Cases, Bottles, Invoice Total, Invoice Number, and Total Price. It also shows totals for Paid Receive, Unpaid Receive, Total Receive, Paid Transfer, Unpaid Transfer, and Total Transfer dollar values.
- For more details, click here: Transfer Report
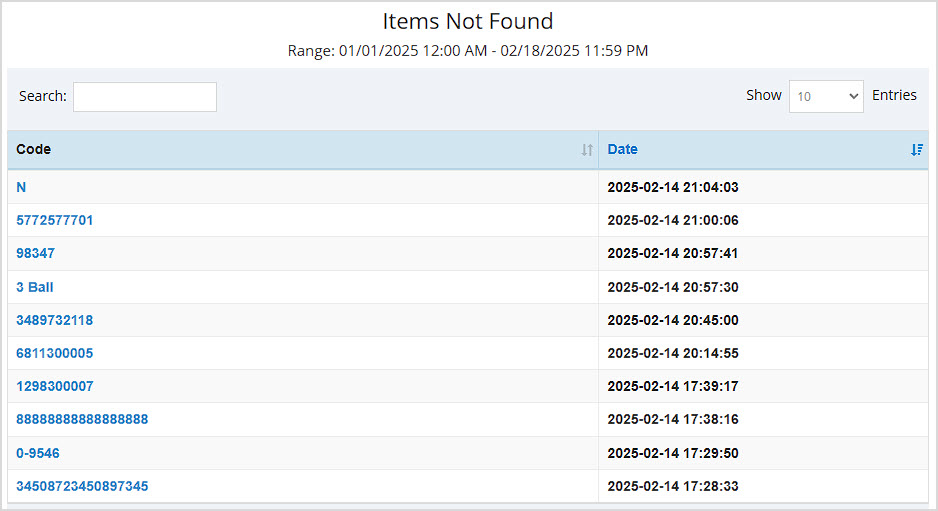
Items Not Found Report
What are your sales clerks searching for but not finding? This report helps you find items that might not have been entered into inventory yet.
- The Data Table displays the Code that was not found and the Date it happened.
- For more details, click here: Items Not Found Report
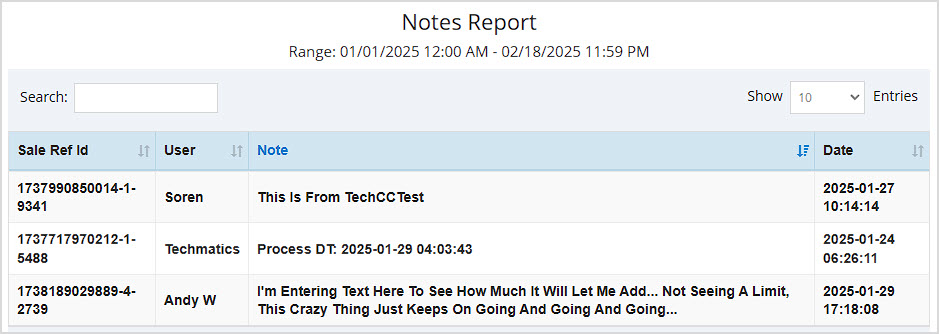
Notes Report
This report offers a compilation of all Notes saved on transactions done through the POS Register for whatever date range you choose.
- The Data Table displays the Sales Ref ID of the transaction, User, Note text, and the Date it was saved.
- For more details, click here: Notes Report
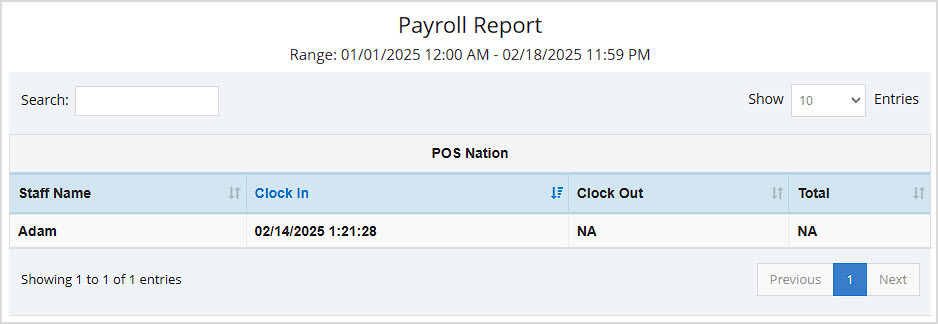
Payroll Report
This report allows you to see total clocked-in time for your staff for whatever date range you have selected.
- This report can be unfiltered using the None option (shown below) or can be filtered by members of your Staff. There are additional filters to view data by an individual Staff member, and by Store.
- The Data Table for the unfiltered (None) view displays Staff Name, Clock In date and time, Clock Out, and Total time accrued.
- The Data Table for the By Staff view shows Staff Name, Mobile number, Store Total time accrued, and Grand Total time accrued if they worked in multiple stores.
- For more details, click here: Payroll Report
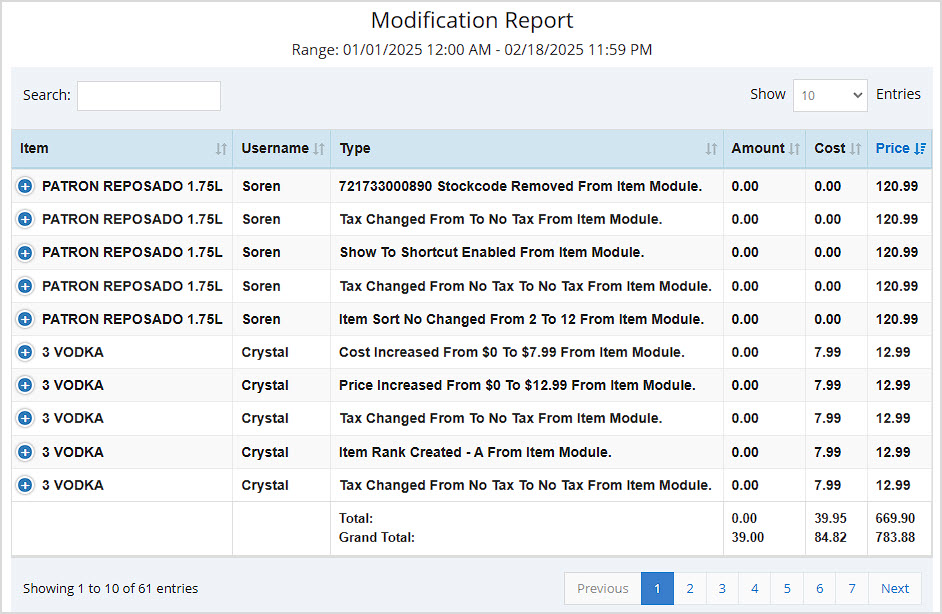
Modification Report
This report compiles events where any data changes were made to your inventory.
- This report can be filtered by Item (shown below), Category, Supplier, and Task List.
- The Data Table for the Item view displays the Item name, Username of who made the modification, Type of modification, Amount, Cost, and Price.
- The Data Table for the Category view displays the Category Name, Message, Action, Action By, and Date & Time of the event.
- The Data Table for the Supplier view displays the Supplier Name, Message, Action, Action By, and Date & Time of the event.
- The Data Table for the Tasklist view displays the Tasklist Name, Message, Action, Action By, and Date & Time of the event.
- For more details, click here: Modification Report
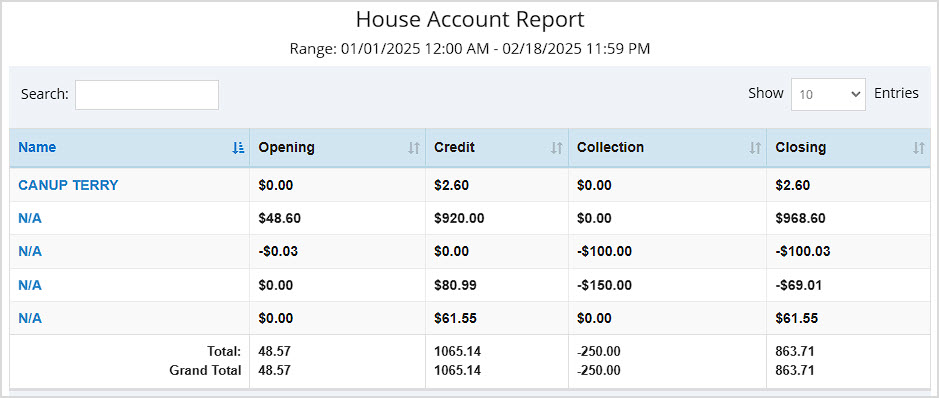
House Account Report
This report shows important amounts for your House Accounts for the date range you choose.
- The Data Table displays the house account Name, Opening balance, Credit amount, Collection amount, and Closing amount. It also provides Totals for all numeric columns.
- For more details, click here: House Account Report
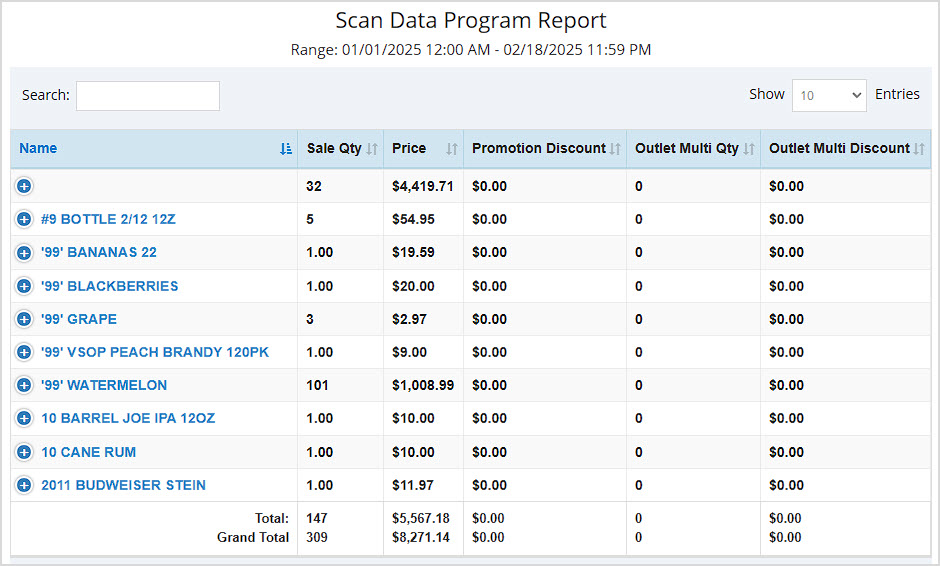
Scan Data Report
In this report you can find a comprehensive list of all items scanned into your POS Register for the date range you have chosen.
- The Data Table displays the item Name, Sale Quantity, Promotion Discount, Outlet Multi Quantity, and Outlet Multi Discount. It also shows Totals and Grand Totals (across all pages of data) for all numeric columns.
- For more details, click here: Scan Data Report
Message Sent History Report
For SMS messages you send to customers, this report gives important send and receive information for whatever date range you select.
- The Data Table displays the Message text, the Total Send To Number of customers, the Failed To Number, and the Sent On date and time.
- For more details, click here: Message Sent History Report

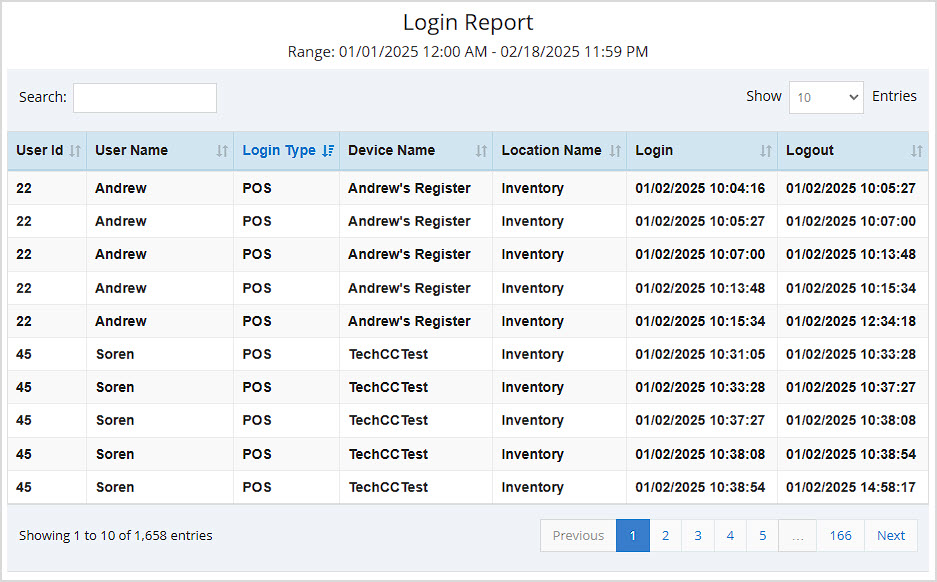
Login Report
See all system logins and logouts for all staff members in this useful report.
- The Data Table displays the staff member's User ID, User Name, Login Type, Device Name, Location Name, Login date and time, and Logout date and time.
- For more details, click here: Login Report
Related Topics
Frequently Asked Questions
Q: Can I print my reports from the Admin?
A: Yes. If you have a printer connected to your device, you can click the Print button in the upper right to print the current page of the report you are viewing.
Q: I don't see a way to switch stores in the Sales Report, how do I see data for my other stores?
A: While some of the reports have a filter for Store, most will show you data for the store your User account is currently logged into. You can click the Logout button in the upper right and then log in again to choose a different store.
Q: I have a question, but I can't find my answer here, how do I get more assistance?
A: You can ask any question at the number below. Contact our 24/7 support team at: (877) 381-4087
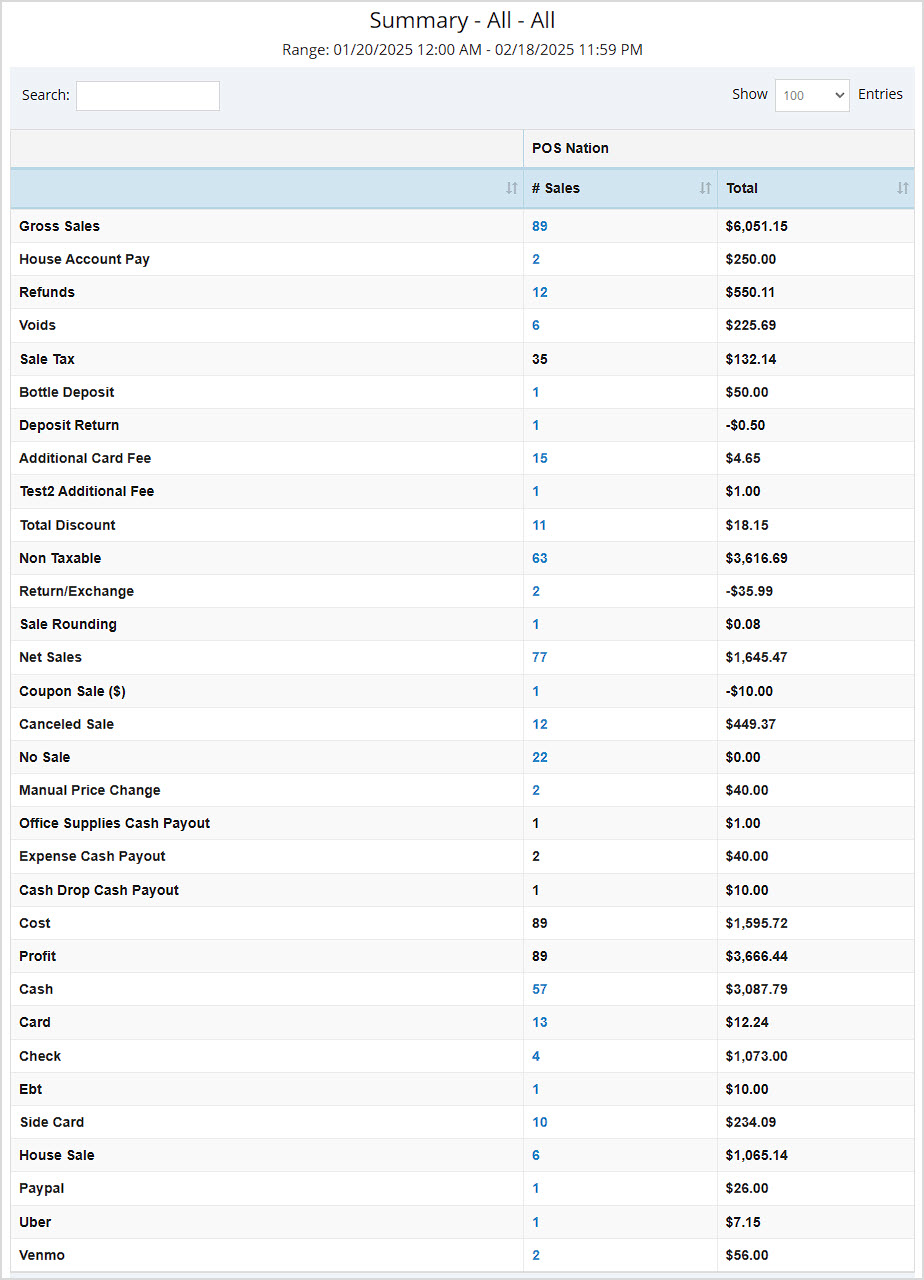
The Summary Report shows a general summary of your sales information and can be filtered by store, register, shift, user, and date.

Summary Report Video
Viewing the Summary Report Page
The Summary Report is a useful report that offers an overview of your Bottle POS sales. Log into the Admin app and click on Reports. The Reports page with the Summary Report will open for you by default.
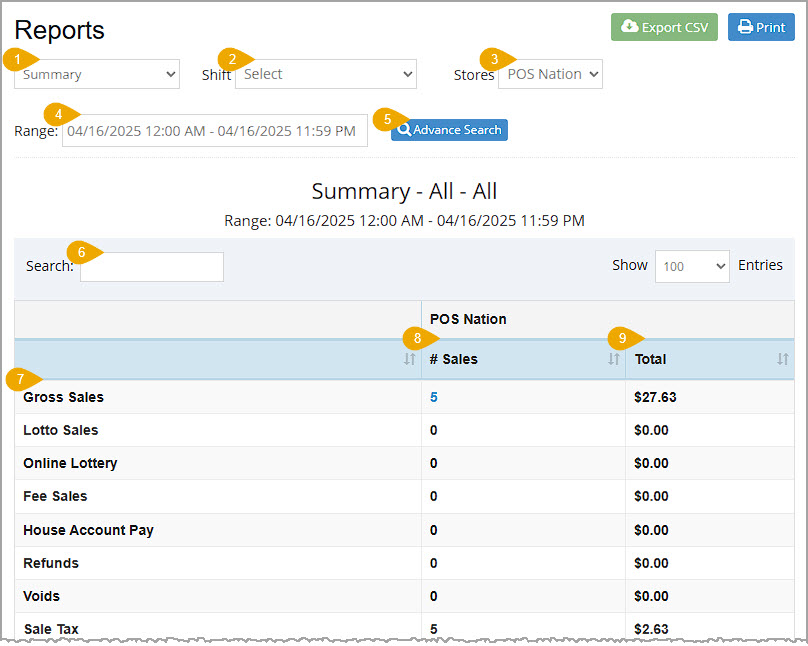
If needed, in the upper right you can click the Export CSV button to export the data in the report. You can also click the Print button to either print the report to a connected printer or download the report as a PDF file. In the data table you can click on the column headers to sort the report alphanumerically. Here are the features of the Summary Report:
- Report List – Use the Report List to load whatever report you want to view. The Summary Report will load by default when you open the Reports page.
- Shift – You can use the Shift drop-list to view data from a specific Shift if you are viewing a single Store's sales summary. If the Stores filter is set to All, you will not see this option.
- Stores – Use this filter to view data for a specific store, or select the All option to view data for all of your stores.
- Range – By default this will load data for the current day. If you want a specific date range click in the box to select the dates you want.
- Advanced Search – Click this button to filter the data by User, Device, or Item Type.
- Search – Enter text into the Search to find a specific item or value.
- Financial Summary – The Summary report has a wealth of Data Points for register activity such as sales, House Account payments, refunds and voids, taxes, fees, discounts, promotions, canceled and No Sale events, payouts, cost, profit, and sales by Tender type. The Data Point names display in this column.
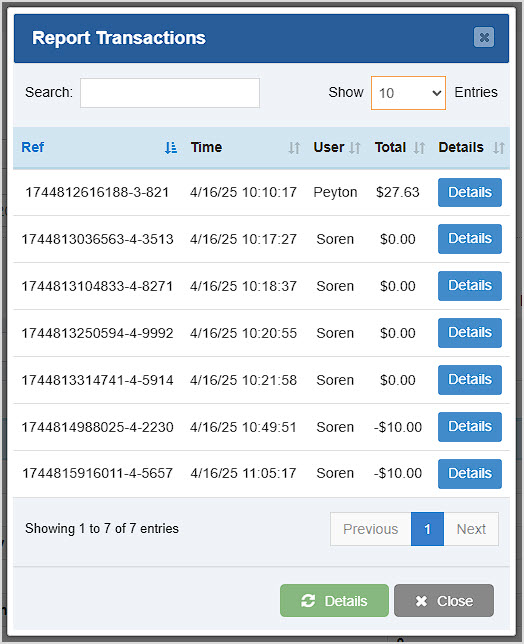
- Number of Sales – This column displays the number of sales for each of the Data Points, where applicable. You can click on the numbers to open a window showing a list of all the transactions and giving you the Reference Number, Time and Date, User, and Total for each. You can also click to view the full Details of each transaction.
- Total – This column shows the total dollar amounts for each Data Point.
Related Topics
How to Run Reports for Customers
Frequently Asked Questions
Q: Can I print my reports from the Admin?
A: Yes. If you have a printer connected to your device, you can click the print button in the upper right of the report page to print the report you are viewing.
Q: I have a question, but I can't find my answer here, how do I get more assistance?
A: You can ask any question at the number below. Contact our 24/7 support team at: (877) 381-4087
The Sales report allows you to see your sales numbers by item, supplier, category, and more. Keep reading to learn more!

To view your Sales Report, open the back office Admin. Click Reports.
How to Run a Sales Report
Viewing Your Sales Report
You can click the Export CSV button to download a CSV spreadsheet file of all the report data. You can also click the Print button to print the current page of the report you're viewing. In the report, you can click any of the column headers to sort alphanumerically, and click again to reverse the sort.
- From the Reports drop-list, select the Sales Report. The page will load the Item Sales view.
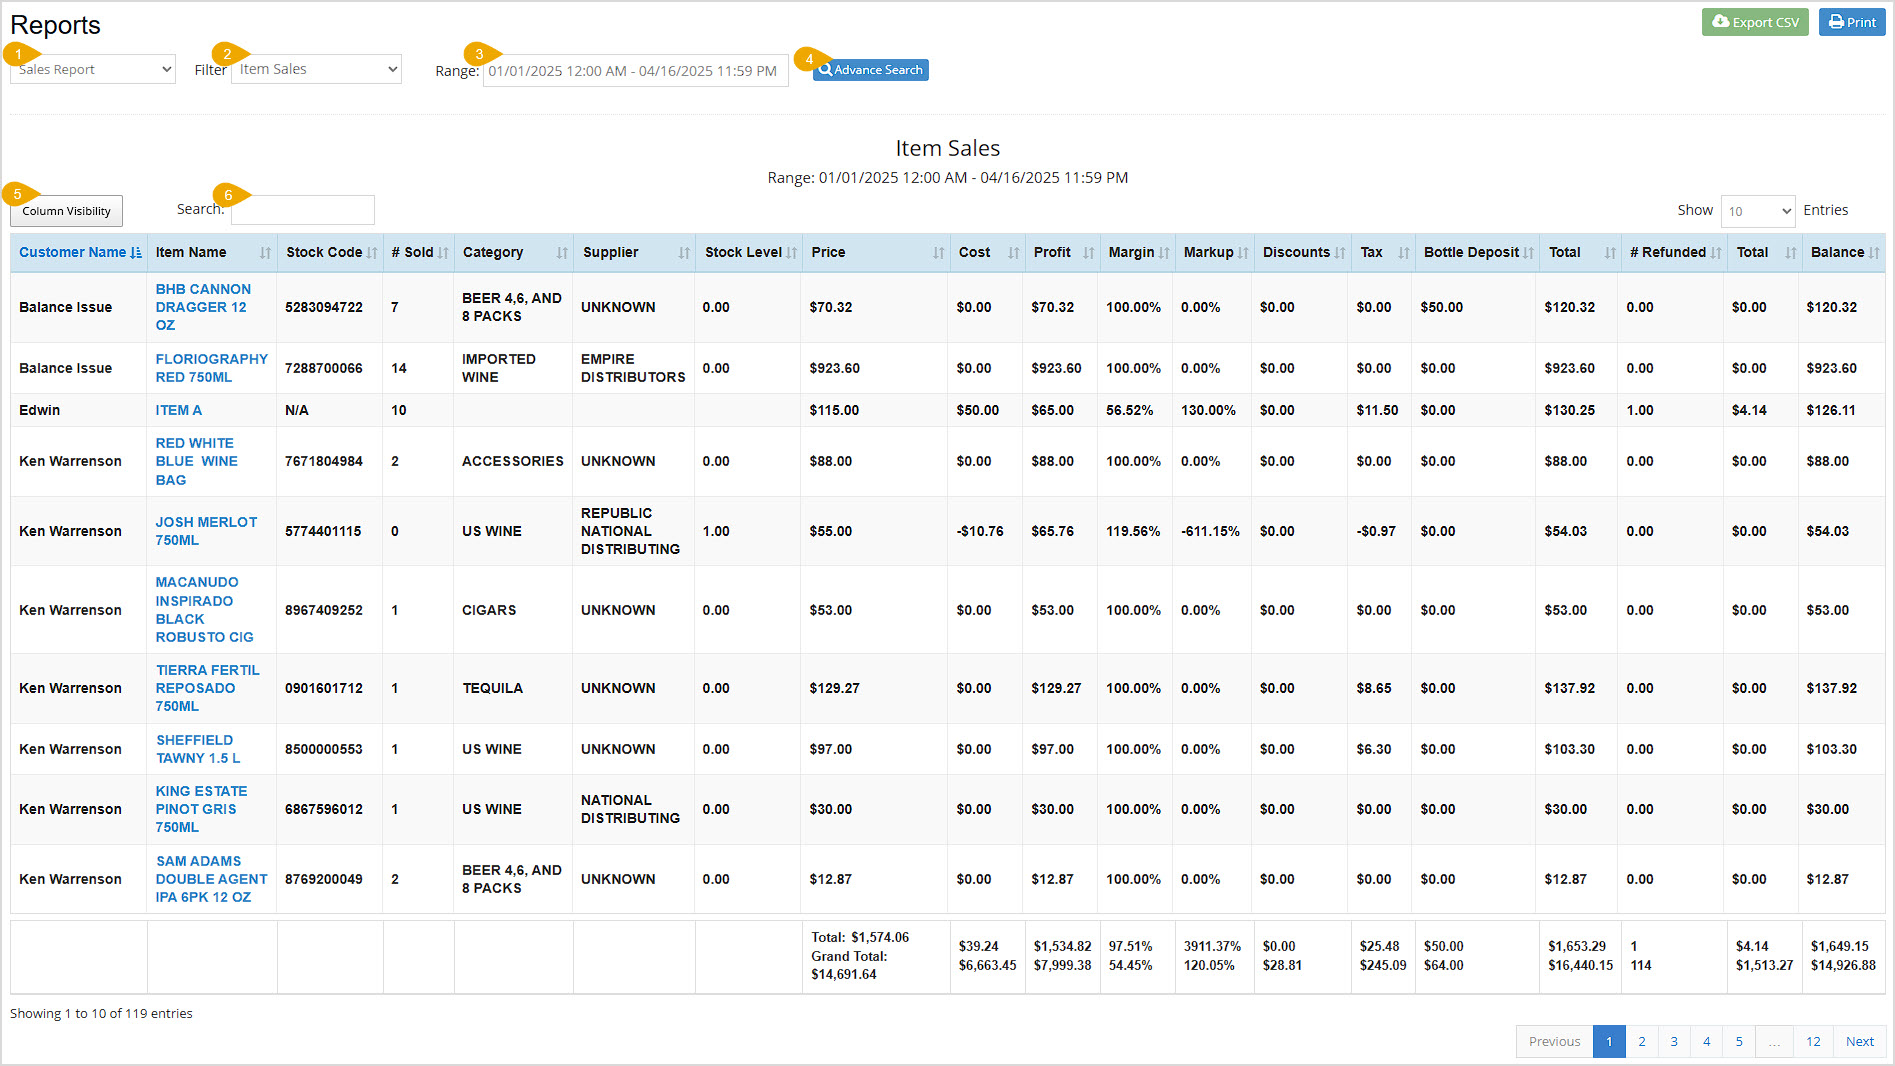
- Filter – Click this to view a drop-down menu to filter views for the report. Your options are Item Sales, Supplier Sales, Category Sales, Rank Sales, Category Group Sales, or Item Sizes.
- Range – This will automatically populate with the current date and time. If you want a different date range click in the box to select the dates you want.
- Advanced Search – Click this button to filter the Items Sales view of the report for a Customer, Supplier, Category, User, Device, or Item Type.
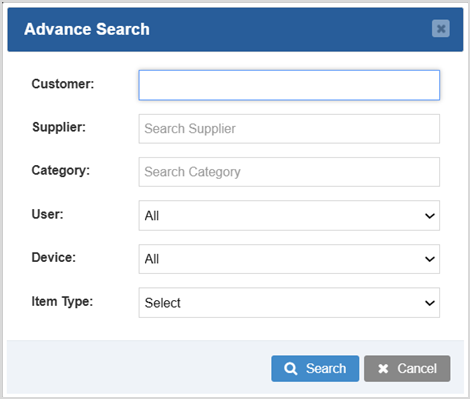
- Column Visibility – Click this button to set which columns you want visible in the report. Your changes for this will only display until the page is refreshed. You can set default columns in Admin > Settings > General Settings > Other Settings.
- Search – Click to Search by text or number for any data in the report.
Item Sales View
By selecting the Item Sales filter, you will see the following results in the table:
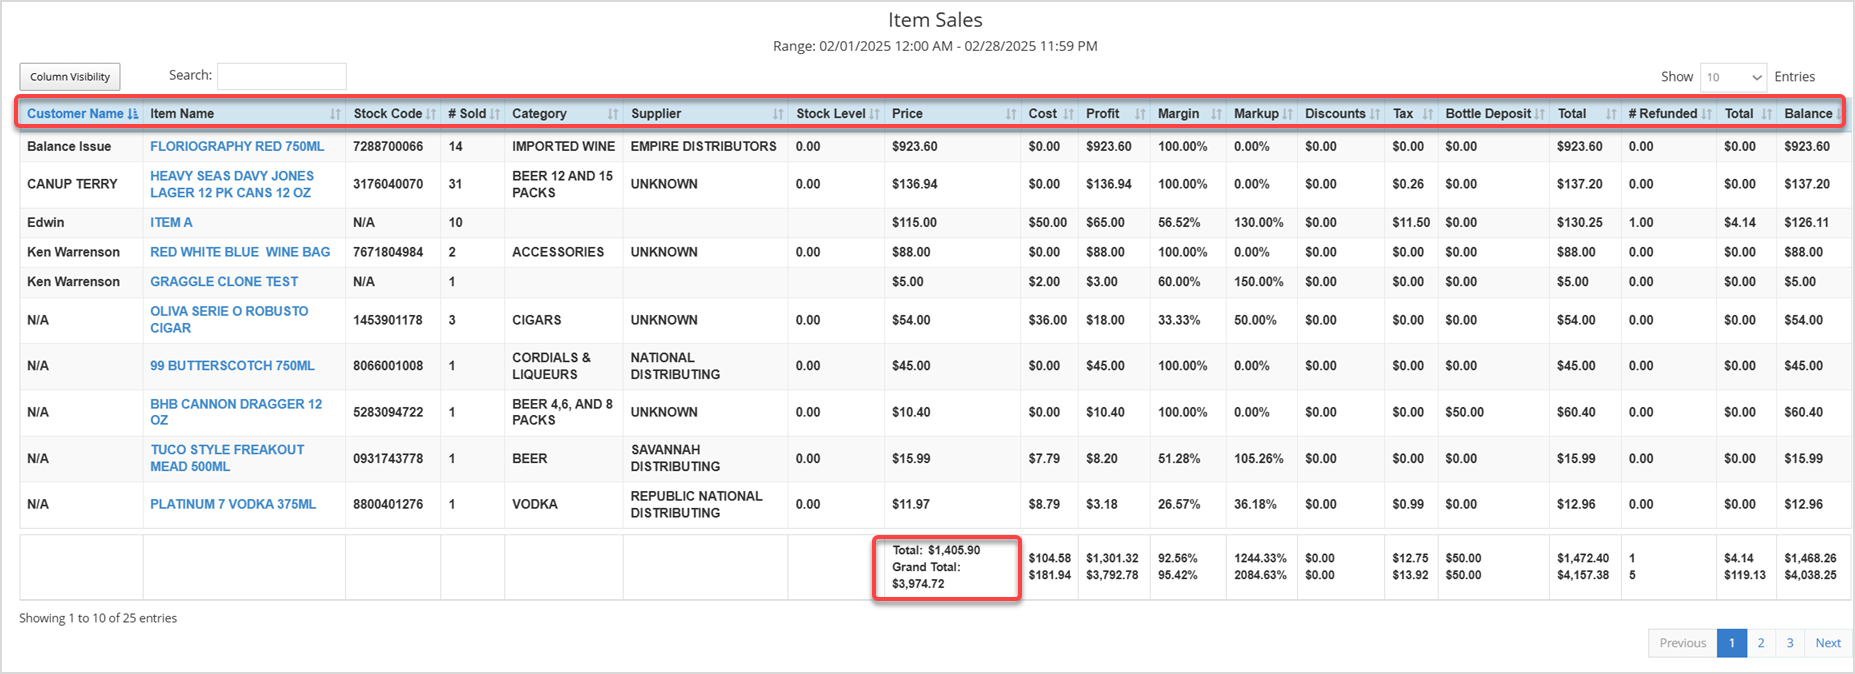
- Customer Name – This column displays the Customer Name, if any, that bought each Item listed.
- Item Name – This column shows the names of the Items sold during the selected date range.
- Stock Code – This column displays each Item's Stock Code. This code is based on the item's UPC.
- Number Sold – This column displays the quantity of each Item sold for the selected date range.
- Category – This column shows the Category of each Item sold.
- Supplier – This column displays the Supplier of each Item sold.
- Stock Level – This column shows the current in-stock quantity of each Item.
- Price – This column shows the total Price dollar value you were paid for each Item sold during the selected date range.
- Cost – This column shows the total Cost dollar value you paid for each Item sold during the selected date range.
- Profit – This column displays the total Profit dollar value you earned for each Item sold during the selected date range.
- Margin – This column shows the Margin percentage of your profits for each Item.
- Markup – This column displays the Markup percentage over your cost for your pricing for each Item.
- Discounts – This column displays discount dollar amount totals, if any, on each Item sold.
- Tax – This column displays the tax totals collected for each Item.
- Bottle Deposit – This value is only applicable if your state requires you to collect bottle deposits. If so, the deposit totals for each Item displays in this column.
- Total – This column displays the total dollar amount collected for each Item after discounts, tax, and bottle deposits, but before refunds.
- Number of Items Refunded – If applicable, this column displays the quantity of the each Item refunded during the selected date range.
- (Refunded) Total – This column displays the total dollar value of the refunded items, if any, for each Item.
- Balance – This column displays the remaining Balance after the deductions from the refunded total are taken out for each Item.
- Total – The Total calculated at the bottom of the table displays the total dollar amount for each column on the current page of the report.
- Grand Total – The Grand Total calculated at the bottom of the table is the total dollar amount for that column for all pages of the report.
Supplier Sales View
By selecting the Supplier Sales filter, the results in the table will be sorted by Supplier:
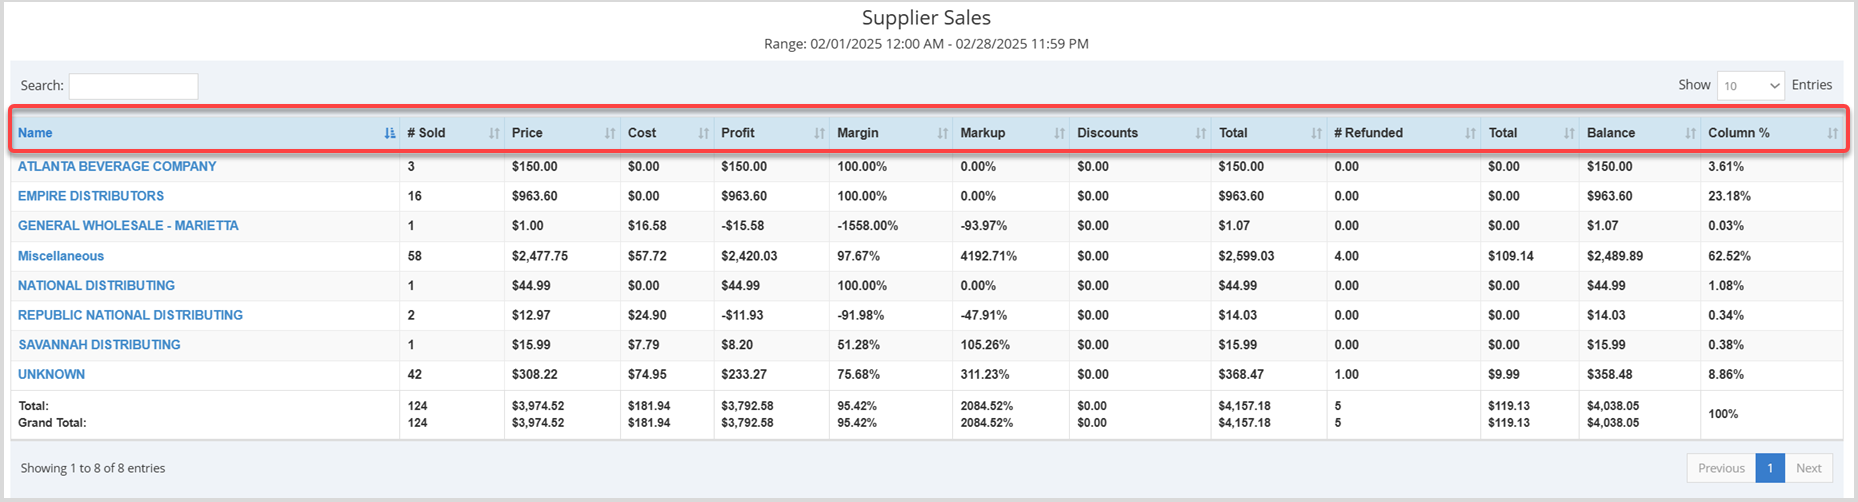
- Name – This column displays the Supplier's name.
- Number Sold – This column displays the quantity of items sold for each Supplier in the selected date range.
- Price – This column shows the total price dollar value you were paid for items sold for each Supplier during the selected date range.
- Cost – This column shows the total cost dollar value you paid for the items sold for each Supplier during the selected date range.
- Profit – This column displays the total profit dollar value you earned for the items sold for each Supplier during the selected date range.
- Margin – This column shows the margin percentage for your profits on items sold for each Supplier.
- Markup – This column displays the markup percentage for your pricing for items sold for each Supplier.
- Discounts – This column displays the discount total dollar value, if any, on the items sold for each Supplier.
- Total – This column displays the total dollar amount for the items sold for each Supplier after discounts and tax, but before refunds.
- Number of Items Refunded – If applicable, this column shows the quantity of the items refunded for each Supplier during the selected date range.
- (Refunded) Total – This column displays the total cost of the refunded items for each Supplier, if any.
- Balance – This column displays the remaining balance of the total after the deductions from the refunded total are taken out for items sold for each Supplier.
- Column % – This column shows the percentage of total sales for each supplier for the date range selected.
Category Sales View
By selecting the Category Sales filter, the results in the table will be sorted by Item Category:
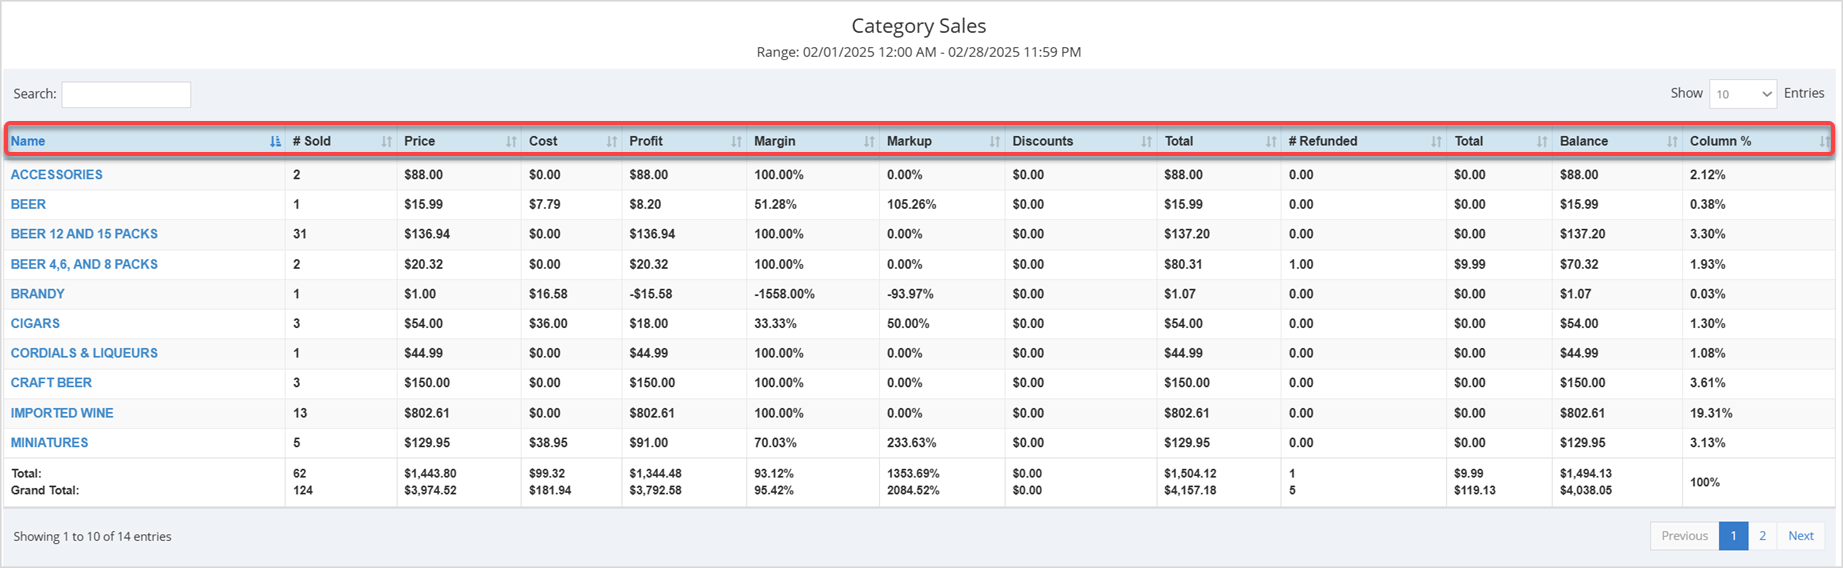
- Name – This column displays the Name of each Category.
- Number Sold – Displays the quantity of each Category's items sold in the selected date range.
- Price – This column shows the total price dollar value you were paid for the items in each Category that sold during the selected date range.
- Cost – This column shows the total cost dollar value you paid for the items in each Category that sold during the selected date range.
- Profit – This column displays the total profit dollar value you earned for the items in each Category that sold during the selected date range.
- Margin – This column shows the margin percentage for your profits for the items in each Category.
- Markup – This column displays the markup percentage for your pricing for the items in each Category that sold.
- Discounts – This column displays discount totals, if any, on the items sold for each Category.
- Total – This column displays the total dollar amount taken in for the items in each Category that sold after discounts and tax, but before refunds.
- Number of Refunded Items – If applicable, this column shows the quantity of the items refunded in each Category during the selected date range.
- (Refunded) Total – This column displays the total cost of the refunded items for each Category, if any.
- Balance – This column displays the remaining Balance after the deductions from the refunded total are taken out for each Category.
- Column % – This column shows the percentage of total sales for each Category for the date range selected.
Rank Sales View
By selecting the Rank Sales filter, the results in the table will be sorted by Rank:
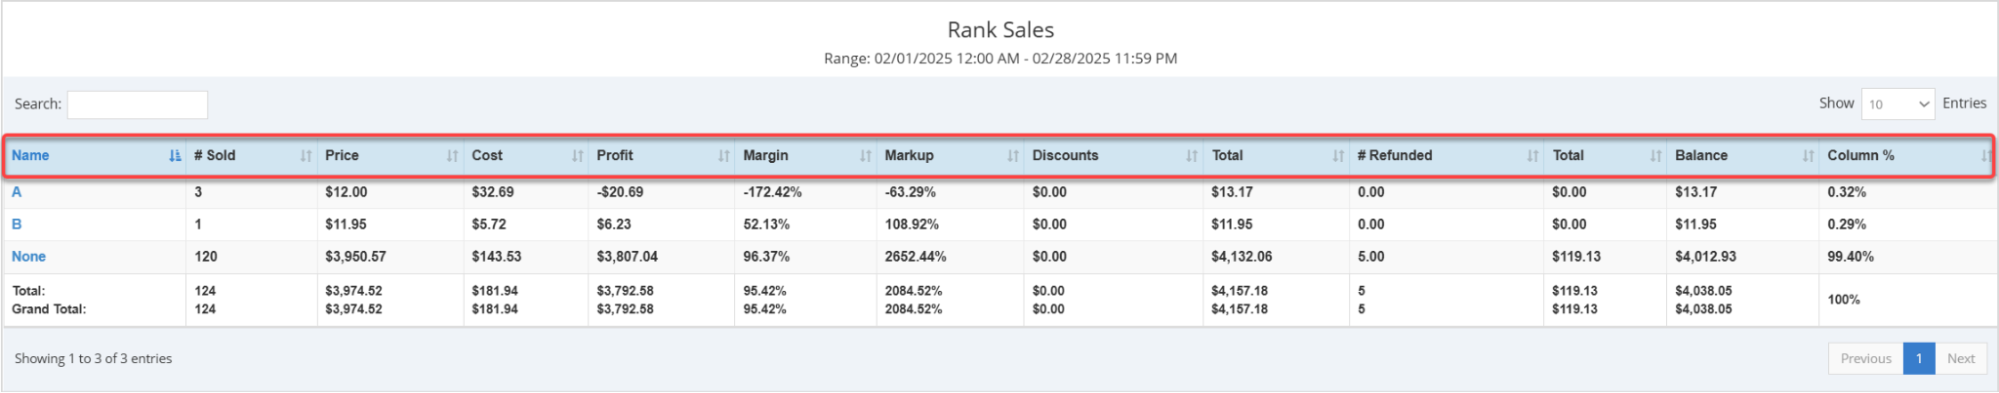
- Name – This column displays the Name of each Rank.
- Number Sold – Displays the quantity of each Rank's items sold in the selected date range.
- Price – This column shows the total price dollar value you were paid for the items in each Rank that sold during the selected date range.
- Cost – This column shows the total cost dollar value you paid for the items in each Rank that sold during the selected date range.
- Profit – This column displays the total profit dollar value you earned for the items in each Rank that sold during the selected date range.
- Margin – This column shows the margin percentage for your profits for the items in each Rank.
- Markup – This column displays the markup percentage for your pricing for the items in each Rank that sold.
- Discounts – This column displays discount totals, if any, on the items sold for each Rank.
- Total – This column displays the total dollar amount taken in for the items in each Rank that sold after discounts and tax, but before refunds.
- Number of Refunded Items – If applicable, this column shows the quantity of the items refunded in each Rank during the selected date range.
- (Refunded) Total – This column displays the total cost of the refunded items for each Rank, if any.
- Balance – This column displays the remaining Balance after the deductions from the refunded total are taken out for each Rank.
- Column % – This column shows the percentage of total sales for each Rank for the date range selected.
Category Group Sales View
By selecting the Category Group filter, the results in the table will be sorted by Category Group:
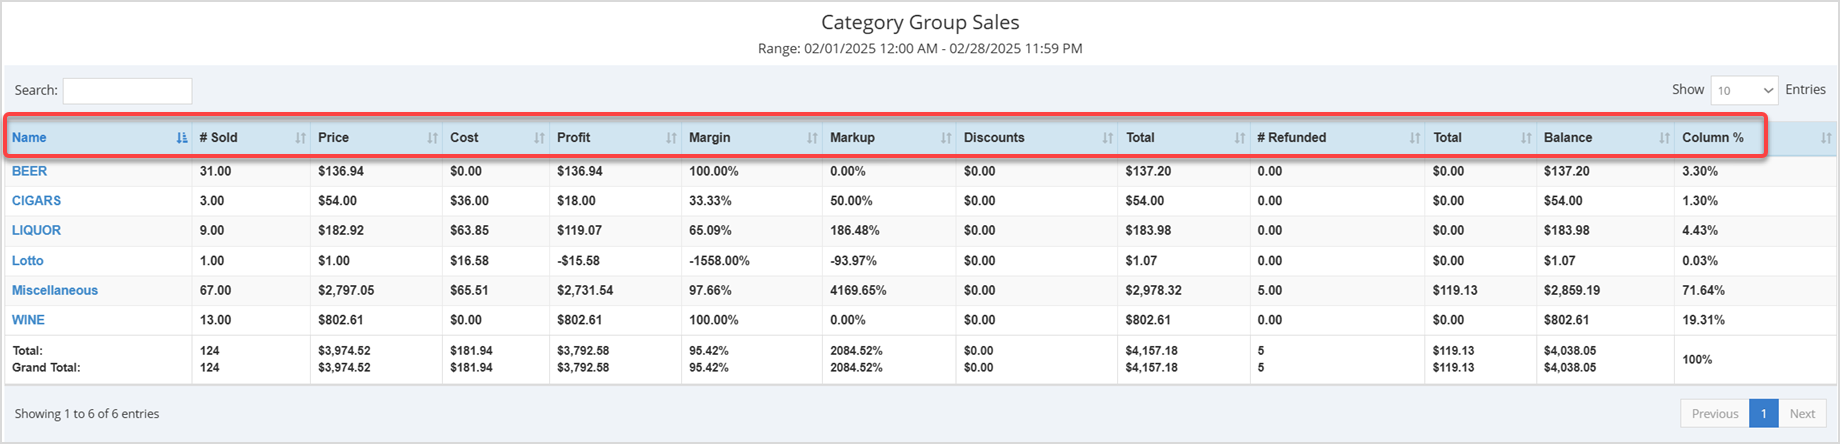
- Name – This column displays the Name of each Category Group.
- Number Sold – Displays the quantity of each Category Group's items sold in the selected date range.
- Price – This column shows the total price dollar value you were paid for the items in each Category Group that sold during the selected date range.
- Cost – This column shows the total cost dollar value you paid for the items in each Category Group that sold during the selected date range.
- Profit – This column displays the total profit dollar value you earned for the items in each Category Group that sold during the selected date range.
- Margin – This column shows the margin percentage for your profits for the items in each Category Group.
- Markup – This column displays the markup percentage for your pricing for the items in each Category Group that sold.
- Discounts – This column displays discount totals, if any, on the items sold for each Category Group.
- Total – This column displays the total dollar amount taken in for the items in each Category Group that sold after discounts and tax, but before refunds.
- Number of Refunded Items – If applicable, this column shows the quantity of the items refunded in each Category Group during the selected date range.
- (Refunded) Total – This column displays the total cost of the refunded items for each Category Group, if any.
- Balance – This column displays the remaining Balance after the deductions from the refunded total are taken out for each Category Group.
- Column % – This column shows the percentage of total sales for each Category Group for the date range selected.
Item Sizes View
By selecting the Item Sizes filter, the results in the table will be sorted by Item size:
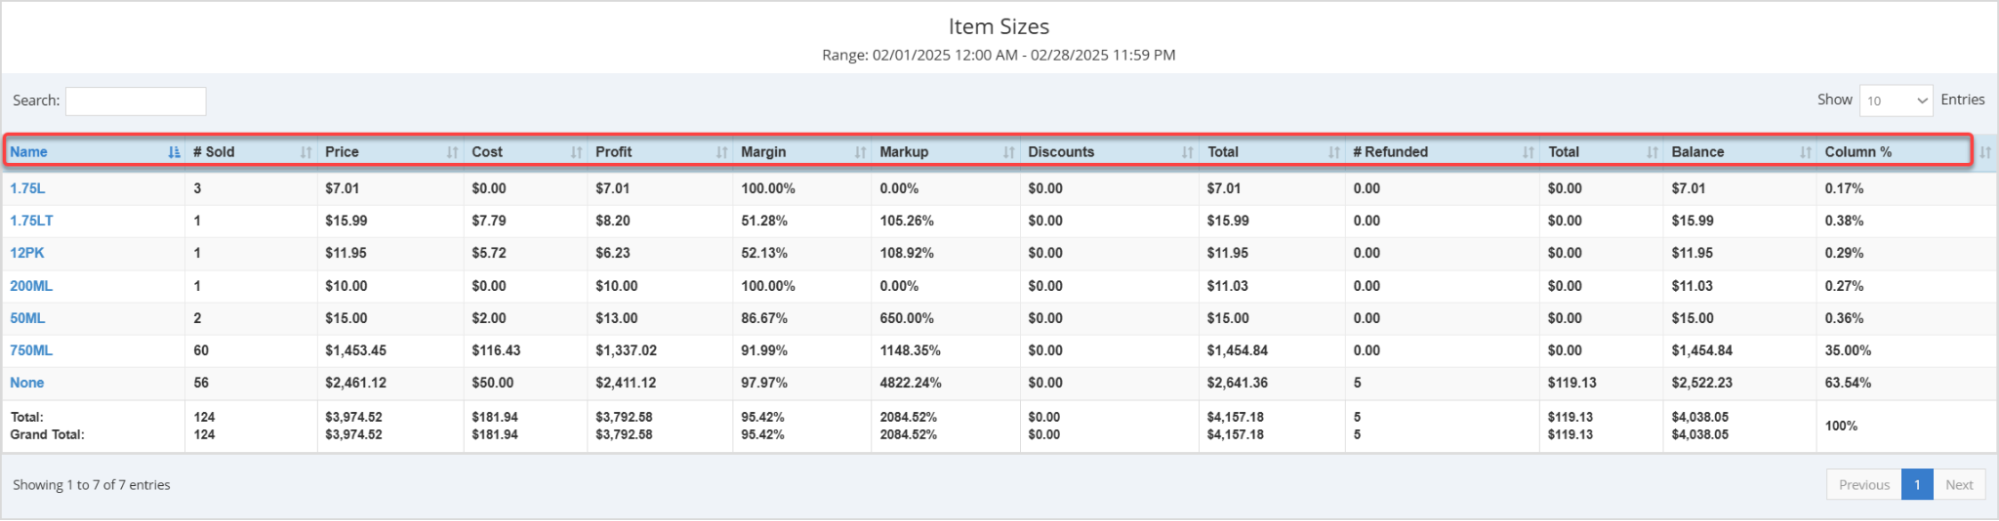
- Name – This column displays the Name of each Item Size.
- Number Sold – Displays the quantity of each Item Size's items sold in the selected date range.
- Price – This column shows the total price dollar value you were paid for the items in each Item Size that sold during the selected date range.
- Cost – This column shows the total cost dollar value you paid for the items in each Item Size that sold during the selected date range.
- Profit – This column displays the total profit dollar value you earned for the items in each Item Size that sold during the selected date range.
- Margin – This column shows the margin percentage for your profits for the items in each Item
Size. - Markup – This column displays the markup percentage for your pricing for the items in each Item Size that sold.
- Discounts – This column displays discount totals, if any, on the items sold for each Item Size.
- Total – This column displays the total dollar amount taken in for the items in each Item Size that sold after discounts and tax, but before refunds.
- Number of Refunded Items – If applicable, this column shows the quantity of the items refunded in each Item Size during the selected date range.
- (Refunded) Total – This column displays the total cost of the refunded items for each Item Size, if any.
- Balance – This column displays the remaining Balance after the deductions from the refunded total are taken out for each Item Size.
- Column % – This column shows the percentage of total sales for each Item Size for the date range selected.
Related Topics
How to Enable Daily Sales Report Text Messages
Frequently Asked Questions
Q: Can I print my reports from the Admin?
A: Yes. If you have a printer connected to your device, you can press the print button on the top right of the report page to print the report you are viewing.
Q: I have a question, but I can't find my answer here, how do I get more assistance?
A: You can ask any question at the number below. Contact our 24/7 support team at: (877) 381-4087
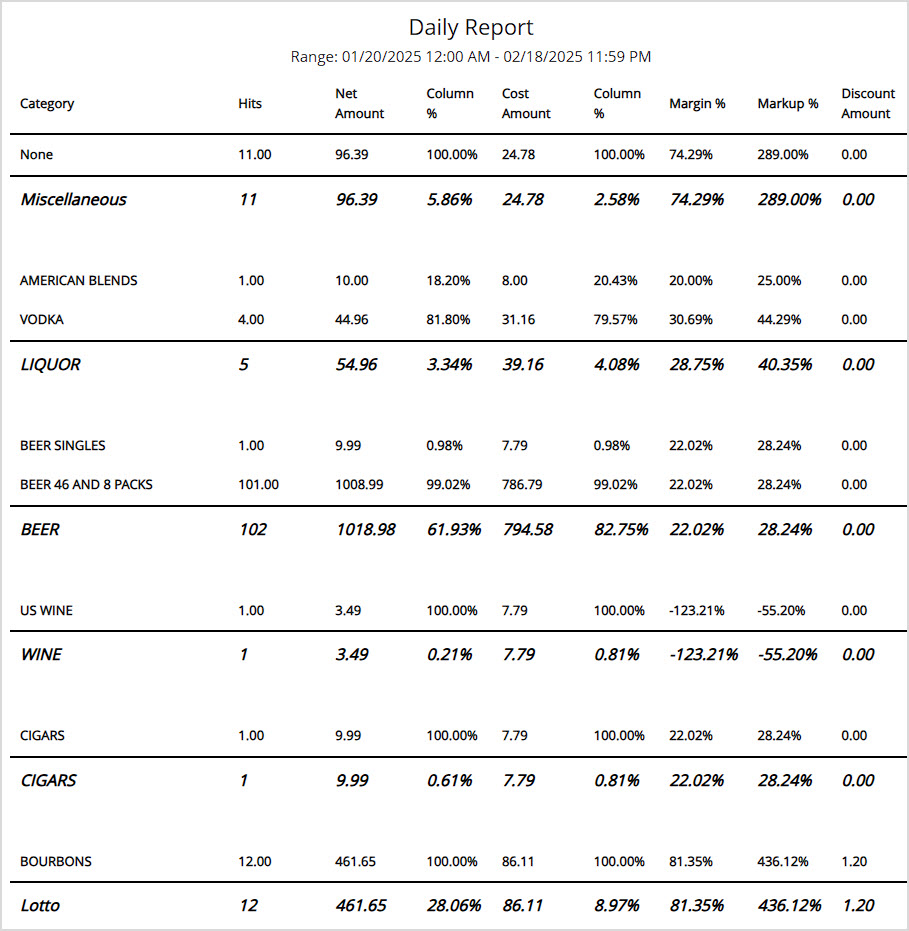
The Bottle POS Admin app's Day Report gives you a wealth of information about what happened in your store during whatever date range you prefer. Take a look at what it has for you!

How to Work with the Day Report
To get to this report, log in to your Admin app and go to Reports. Select Day Report in the report selection drop-list.
Day Report Details
This report is an in-depth analysis of your sales and profits across a specified date range and includes details not shown in any other report. You can use this report to make sure your drawers are balanced at the end of each shift. The Day Report shows data for the Register you are currently logged into.
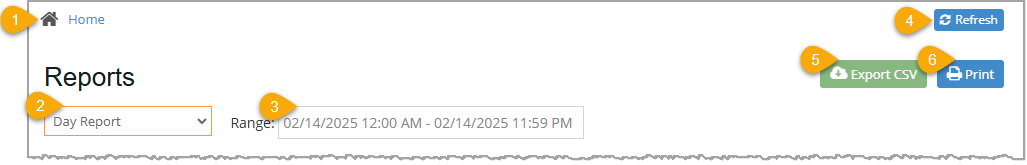
- Home – Click to navigate away from Reports back to your Dashboard.
- Report Drop-List – Click the Day Report to view an analysis of your sales and profits across a specified range of dates.
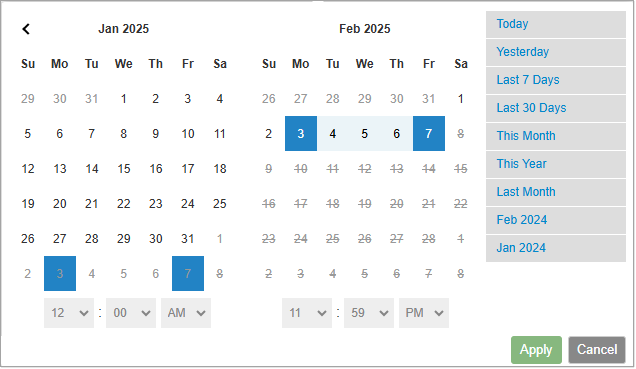
- Range – This is the Date Range used in the report calculations in the table below. Click in this box to select another date or dates from a pop-up window as shown here:
- Refresh – Click to Refresh the page if system data might have changed since you first opened the report.
- Export CSV – Because of the unique formatting of the Day Report, the Export function does not actually work with it yet, but we may develop this in the future.
- Print – Click to print a copy of this report to a PDF file or a printer connected to your computer.
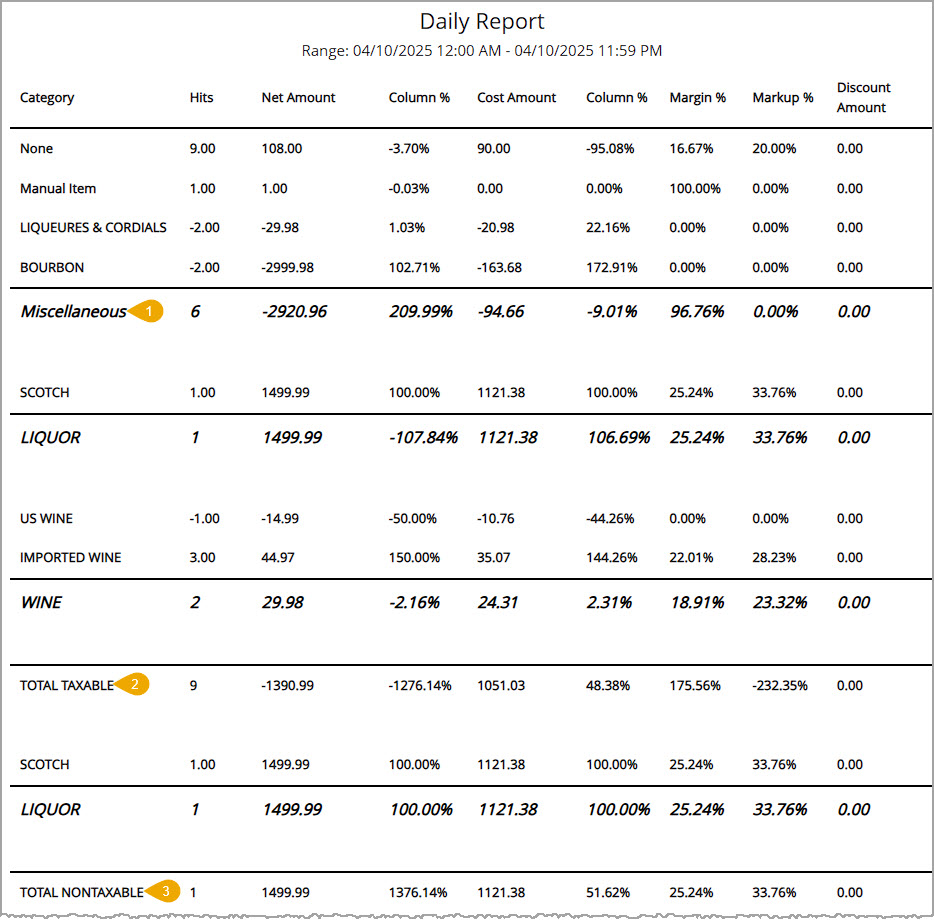
For each of the areas highlighted above, column totals are calculated for the number of taxable sales, dollars earned on taxable sales, your costs, margins, markups, and other relevant information.
- Category Group – This upper area of the Day Report breaks out Categories and then shows the Category Group, subtotaling the sales numbers and percentages, for all Taxable Sales.
- Total Taxable – Below all of your category groupings there is a final Total Taxable line (pictured above) with totals for all your groups.
- Total Nontaxable – In the same way as the taxable sales, all Categories that had non-taxable sales during the date range you've selected are grouped by Category Group, with subtotals for each group. Below the groups there is a final Total Nontaxable with totals for all the groups.
- Total Sales – This area displays column totals for all sales during the date range and includes calculations for any discounts, returns, and voids.
- Total Register – This area displays the total amount of sales plus sales tax, tips, and other similar ledger entries. This is the total amount that should be in the register at the end of the selected date range.
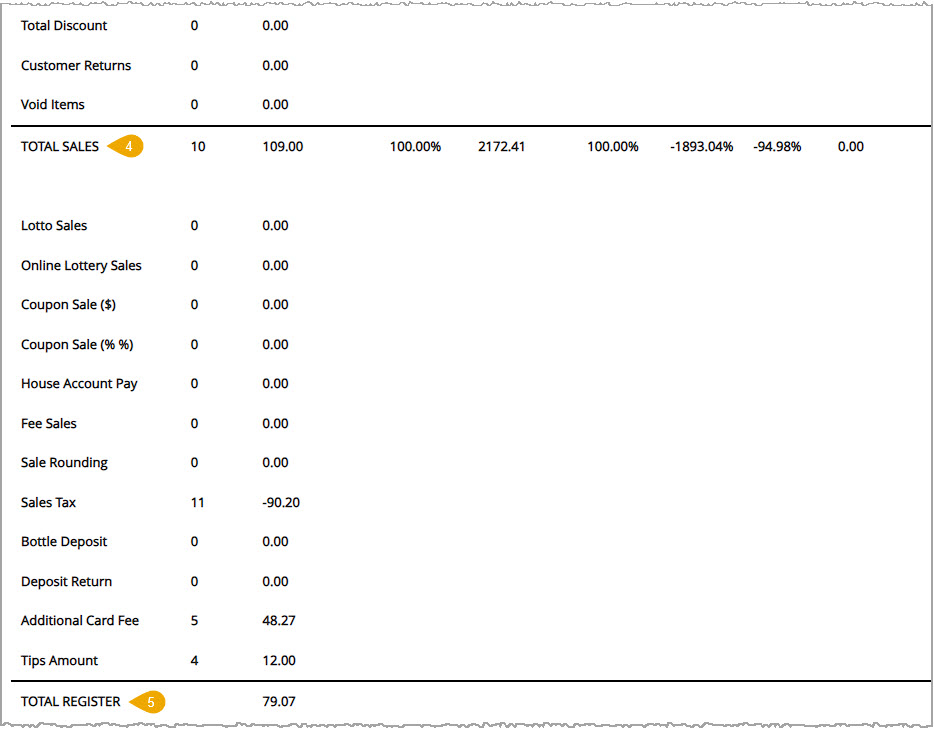
- Total Tendered – This area displays the tender type, the number of times that tender was used, and the dollar value expected for all sales during the date range. The Hits and Expected values are totaled for you. When this number matches the number in Total Register, your register is balanced. Verify that the numbers are correct and that you received this amount in deposit.
- Total Cash – This area displays the cash takings per device with totals for the takings, count, and balance.
- Total Tax – This area displays the sales values for each tax rule including the number of items sold, the dollar amount subtotals, tax amount charged, any refunds, and total taxes after refunds. Each column is totaled for you.
- Total Rank Sale – This area displays the number of sales (Hits), sale amounts, percentage of total sales, cost amounts, percentage of total cost amounts, profit margin percentages, price markup percentages, and discounts of each ranking. Each column is totaled for you.
- Cash Payout – This area displays the total number and total dollar amount of cash paid out of the drawer.
- Customer Count - This area displays the number of customers who made purchases and the average sale dollar amount during the selected date range.
- Hourly Sales – This area displays the number of sales and total dollar value of sales made during each hour of the selected date range. Only hours that had sales are displayed, and if the date range spans multiple days, each hour is totaled across all days.
- Total Hourly Sales – This area displays the total number of sales made and the total dollar amount collected.
- Notes (not shown) – This area shows any Notes saved to transactions, listing the note text, the date and time it was saved, and the Username of the staff member that saved the note.
Related Topics
Frequently Asked Questions
Q: Can I print my reports from the Admin?
A: Yes. If you have a printer connected to your device, you can click the Print button on the top right of the report page to print the current page of the report you are viewing.
Q: I have a question, but I can't find my answer here, how do I get more assistance?
A: You can ask any question at the number below. Contact our 24/7 support team at: (877) 381-4087
The Expenses Report shows all of your expenses for a specified time frame. To view your Expenses Report, you'll need to click on the Reports tab on the left of your POS screen.
Expenses Report
On the Reports page, click on the Reports drop-list and click on Expenses. The Expenses Report will load in the Category view.
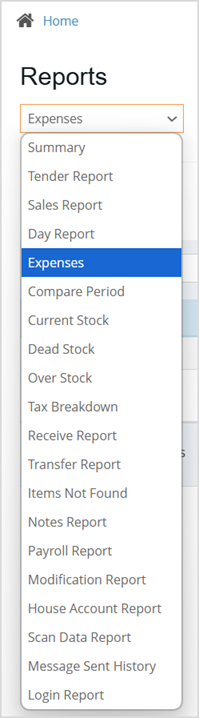
Category View
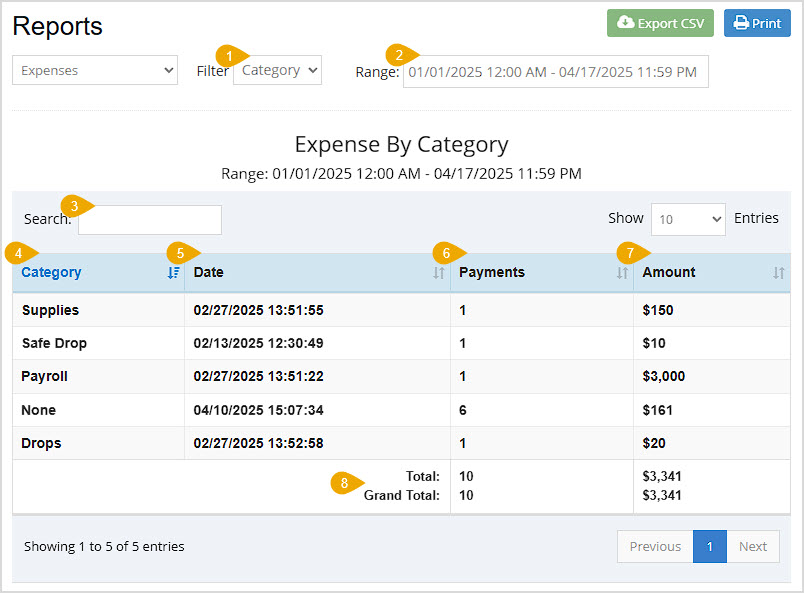
Export CSV – Click this button to download all of the report's data in a CSV spreadsheet file.
Print – Click this button to print the current page of the report.
Column Sorting – Click on the column headers to sort the line items in the report alphabetically or numerically, depending on the column data. Click again to reverse-sort.
- Filter – You can click this drop-list to view your expenses by Category, Vendor, Device, or All.
- Range – This field automatically populates with the current day's date and time. If you want a different date range click in the box to select the dates you want.
- Search – Enter keywords or numbers into the Search field to find a specific item or value.
- Category – This column displays the Expense Category.
- Date – This column displays the Date the most recent expense payment in the category accrued.
- Payments – This column displays the number of Payments made for each category.
- Amount – This column displays the total Amount of all payments for each expense category.
- Total & Grand Total – The total for the Payments and Amount columns on the current page is in the Total row. The total for the Payments and Amount columns across all pages is in the Grand Total row.
All View
Selecting the All filter displays your Expense Report differently. You'll see a new filter at the top and all the same columns from the Category view, plus a few others, described below.
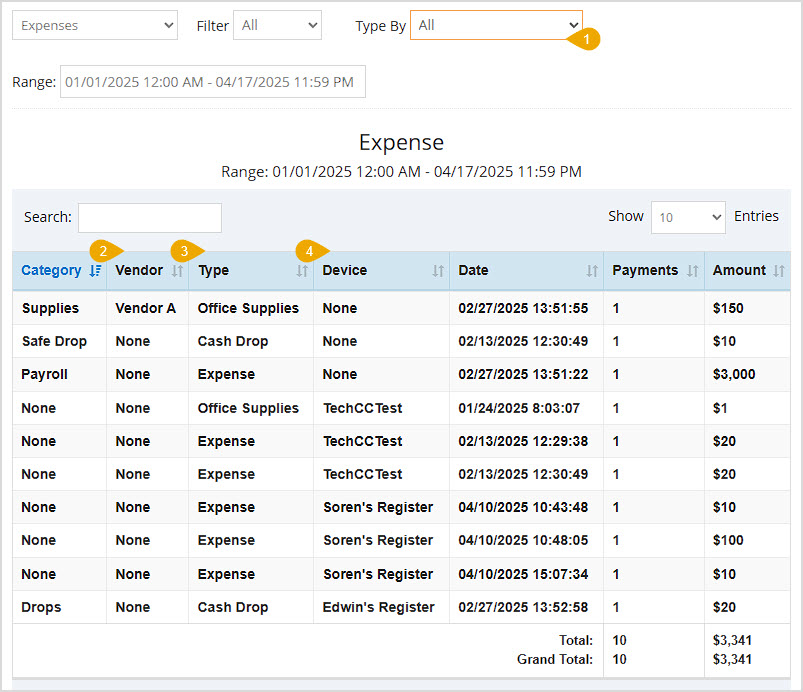
The All filter still shows you the Category, Date, Payments, and Amounts columns described above but adds others as well as an additional filter:
- Type By – This filter lets you show only expenses for a specific Type of expense. By default, you'll see All of your expenses.
- Vendor – This column displays the name of the Supplier associated with the Expense Category.
- Type – This column displays the Type of Expense.
- Device – This column displays the Device from which each Expense was paid out.
Vendor View
The Vendor View of the Expenses report shows the Vendor, Date, Payments, and Amounts columns described above. It arranges your expense data by Supplier.
Device View
The Device View of the Expenses report shows the Device, Date, Payments, and Amount columns described above. It lists expense data by the Device on which each was created.
Related Topics
How to Create and Manage Expenses
Frequently Asked Questions
Q: Can I print my reports from the Admin?
A: Yes. If you have a printer connected to your device, you can press the Print button on the top right of the report page to print the report you are viewing.
Q: I have a question, but I can't find my answer here, how do I get more assistance?
A: You can ask any question at the number below. Contact our 24/7 support team at: (877) 381-4087
Filter by Category
- Accounting
- Getting Started
- Accounting
- Accounting
- Admin Reports
- Getting Started
- Admin Reports
- Admin Reports
- Getting Started
- Admin Reports
- Admin Reports
- Admin Reports
- Admin Reports
- Admin Reports
- Admin Reports
- Admin Reports
- Admin Reports
- Admin Reports
- Admin Reports
- Admin Reports
- Admin Reports
- Admin Reports
- Admin Reports
- Admin Reports
- Admin Reports
- Admin Reports
- Admin Reports
- Admin Reports
- Admin Reports
- Admin Reports
- Register
- Admin Reports
- Admin Reports
- Register
- Admin Reports
- Settings
- Getting Started
- Settings
- Getting Started
- Settings
- Settings
- Getting Started
- Settings
- Getting Started
- Settings
- Getting Started
- Settings
- Getting Started
- Settings
- Getting Started
- Settings
- Settings
- Settings
- Getting Started
- Settings
- Getting Started
- Settings
- Settings
- Settings
- Settings
- Settings
- Settings
- Getting Started
- Settings
- Settings
- Settings
- Getting Started
- Settings
- Customers
- Getting Started
- Customers
- Customers & Discounts
- Customers
- Customers
- Getting Started
- Customers
- Customers
- Customers & Discounts
- Taxes
- Help
- Getting Started
- Help
- Help
- Help
- Help
- Getting Started
- Help
- Help
- Payments
- Getting Started
- Help
- Getting Started
- Help
- Getting Started
- Help
- Help
- Payments
- Getting Started
- Help
- Help
- Payments
- Help
- Help
- Items
- Getting Started
- Items
- Items
- Getting Started
- Items
- Items
- Items
- Getting Started
- Items
- Items
- Getting Started
- Items
- Items
- Getting Started
- Items
- Items
- Getting Started
- Items
- Getting Started
- Items
- Items
- Getting Started
- Items
- Getting Started
- Items
- Getting Started
- Items
- Items
- Items
- Getting Started
- Register
- Settings
- Getting Started
- Register
- Getting Started
- Register
- Register
- Register
- Register
- Register
- Register
- Register
- Getting Started
- Register
- Getting Started
- Register
- Register
- Getting Started
- Register Reports
- Getting Started
- Register Reports
- Register Reports
- Register
- Accounting
- Getting Started
- Register
- Items
- Register
- Customers
- Register
- Admin Reports
- Register
- Admin Reports
- Register
- Register Reports
- Accounting
- Getting Started
- Register
- Items
- Register
- Settings
- Getting Started
- Register
- Register
- Help
- Settings
- Getting Started
- Settings
- Getting Started
- Settings
- Register
- Getting Started
- Register Reports
- Register Reports
- Register Reports
- Register Reports
- Register Reports
- Admin Reports
- Admin Reports
- Admin Reports
- Admin Reports
- Admin Reports
- Help
- Register
- Help
- Customers
- Settings
- Register
- Settings
- Settings
- Settings
- Settings
- Settings
- Settings
- Settings
- Settings
- Settings
- Settings
- Settings
- Settings
- Settings
- Settings
- Settings
- Settings
- Settings
- Settings
- Settings
- Settings
- Settings
- Settings
- Settings
- Settings
- Settings
- Settings
- Settings
- Settings
- Items
- Items
- Admin Reports
- Admin Reports
- Admin Reports
- Settings
- Help
- Help
- Payments
Search results for:
AI Overview
Sort by Relevance
Description